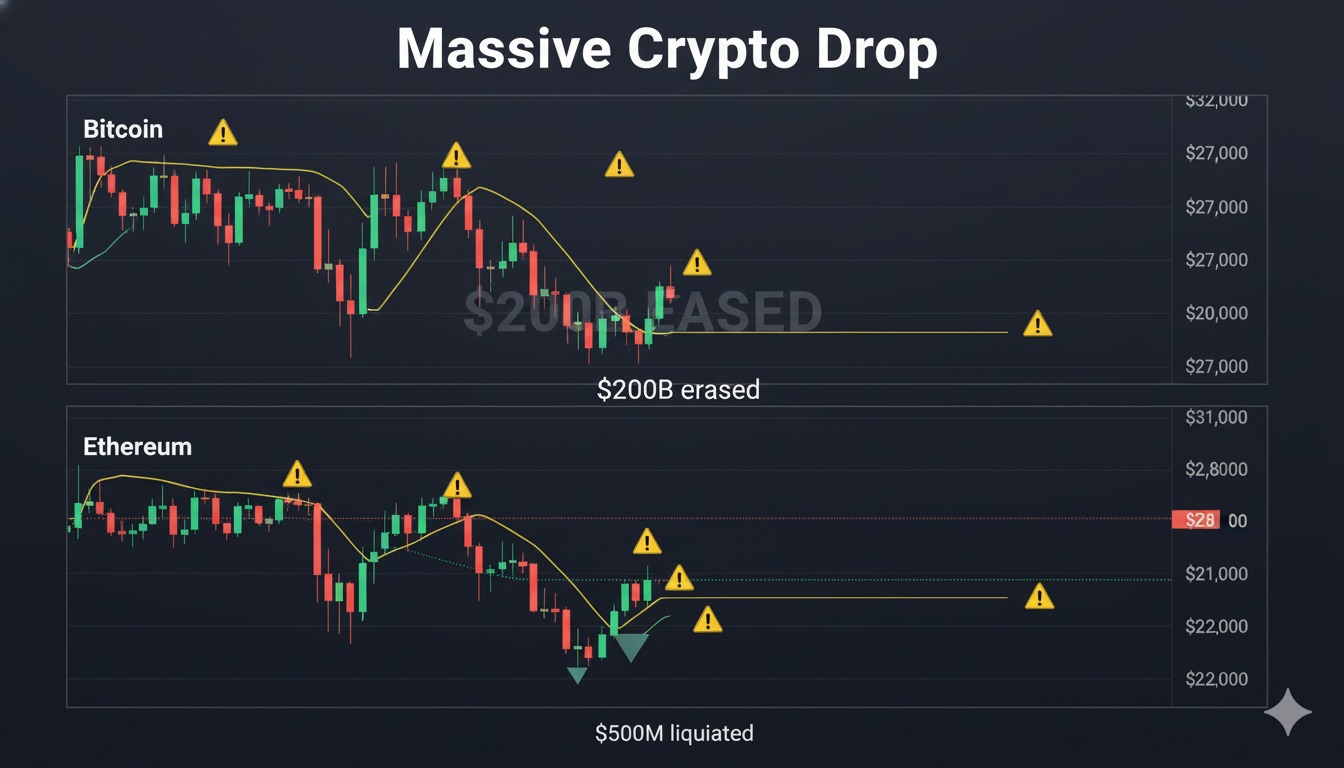
Bitcoin experienced a sudden $5,000 drop while Ethereum fell below $2,800, erasing $200 billion from the crypto market and liquidating over $500 million in positions with no clear catalyst.
Bitcoin plunged dramatically overnight, losing over $5,000 in value while Ethereum slipped below $2,800. The sudden market downturn erased $200 billion from the cryptocurrency market within hours and liquidated over $500 million in long positions.
No major catalyst emerged to explain the crash. No tariff announcements from President Trump. No hawkish statements from Federal Reserve Chairman Powell. No Bitcoin sales from MicroStrategy's Michael Saylor. Yet the market behaved as if a major entity engaged in panic selling.
According to CryptoRover on X, the crash defied conventional market logic. Bitcoin dropped $5,000 while altcoins plummeted 10% to 20%. The behavior mirrored patterns seen after the October 10th crash, suggesting deeper structural issues.
Market liquidity has thinned considerably. Major players have reportedly pivoted toward stocks and precious metals. Spot demand has faded while existing whales appear to be selling their holdings. This creates conditions where any news brings selling pressure.
Whale Activity and Market Manipulation Claims
CryptoGoos on X pointed to suspicious whale behavior. Large holders closed long positions immediately before the crash, raising questions about market manipulation. The timing suggested some participants had advance knowledge of the downturn.
The crash occurred during Bitcoin's most illiquid trading window. Sunday night around midnight saw thin order books and low market maker volume. No U.S. ETF flow existed to provide support. A single macro trigger pushed prices through multiple support levels.
According to TedPillows on X, the timing was remarkable. Japan's 2-year yield broke above 1%, increasing the likelihood of Bank of Japan tightening. Rising funding costs forced global risk repricing. High-beta assets like Bitcoin typically react first to such shifts.
Stops were hit rapidly. Leveraged positions unwound in cascading fashion. Liquidations flowed through the order book systematically. Meanwhile, gold and silver futures moved higher, suggesting a broader risk-off rotation.
Technical Indicators Signal Prolonged Downturn
The monthly MACD histogram has turned bearish, a warning that has preceded prolonged downturns in every major cycle since 2012. The indicator printed its first red bar below zero in November as prices fell over 17%.
This bearish crossover signals the bull run that began around $20,000 has ended. Bears have taken control. Historical patterns following similar MACD crossovers in 2018 and 2014 preceded deepening bear markets. The 2021-2022 downturn saw prices fall from $70,000 to below $20,000 after a bearish MACD signal.
Several macro risks reinforce the negative signal. Japan's fiscal strain continues. The dollar index remains resilient despite Federal Reserve rate cut discussions. Recent outflows from spot ETFs add pressure.
Ethereum confirmed a death cross pattern. The 50-day simple moving average crossed below the 200-day SMA. This marks short-term trends underperforming long-term trajectories. The pattern has potential to evolve into a full-blown bear market.
Contrarian Views Point to Potential Bottom
Not everyone sees doom ahead. CryptosR_Us on X highlighted significant liquidity stacked on the top side. Coinglass data shows $564.7 million in longs wiped out in 24 hours. Markets typically follow liquidity, suggesting the next move could be upward.
The same analyst drew parallels to 2021. This chart pattern appears reversed from that cycle. Bitcoin topped in 2021 while everyone felt optimistic. Now it may be bottoming while sentiment is terrible.
Bitcoin dominance is trending up. ETH/BTC sits on long-term support. Price is reacting cleanly to the main trendline. Nothing suggests a market breaking down. Instead, it looks like a market resetting for the next move.
People hated buying bottoms in previous cycles too. The pattern repeats with remarkable consistency. Fear dominates at lows. Optimism peaks at tops. Current sentiment suggests a potential accumulation phase rather than distribution.
First support lies near $84,500, defined by the trendline linking 2023-2024 higher lows. A break would expose April's low around $74,500, then the 2021 peak near $70,000. Traders need vigilance for downside volatility.
Related reading: Block Joins S&P 500 Unleashing Bitcoin Shockwaves
Related reading: Bitcoin Wrench Attacks Set to Surge Past 2021 Record Amid Price Boom
Related reading: Block Joins S&P 500 Unleashing Bitcoin Shockwaves
Related reading: Trump Set to Unlock 401Ks for Crypto, Gold and Private Equity Boom
Key Topics
Crypto New Live
admin@cryptonewslive.org
Bitcoin Crashes $5K With No Clear Trigger Explained
Bitcoin plunged $5K and Ethereum fell below $2.8K in mysterious crash. $500M liquidated, $200B wiped out. Japan rates and whale activity blamed.