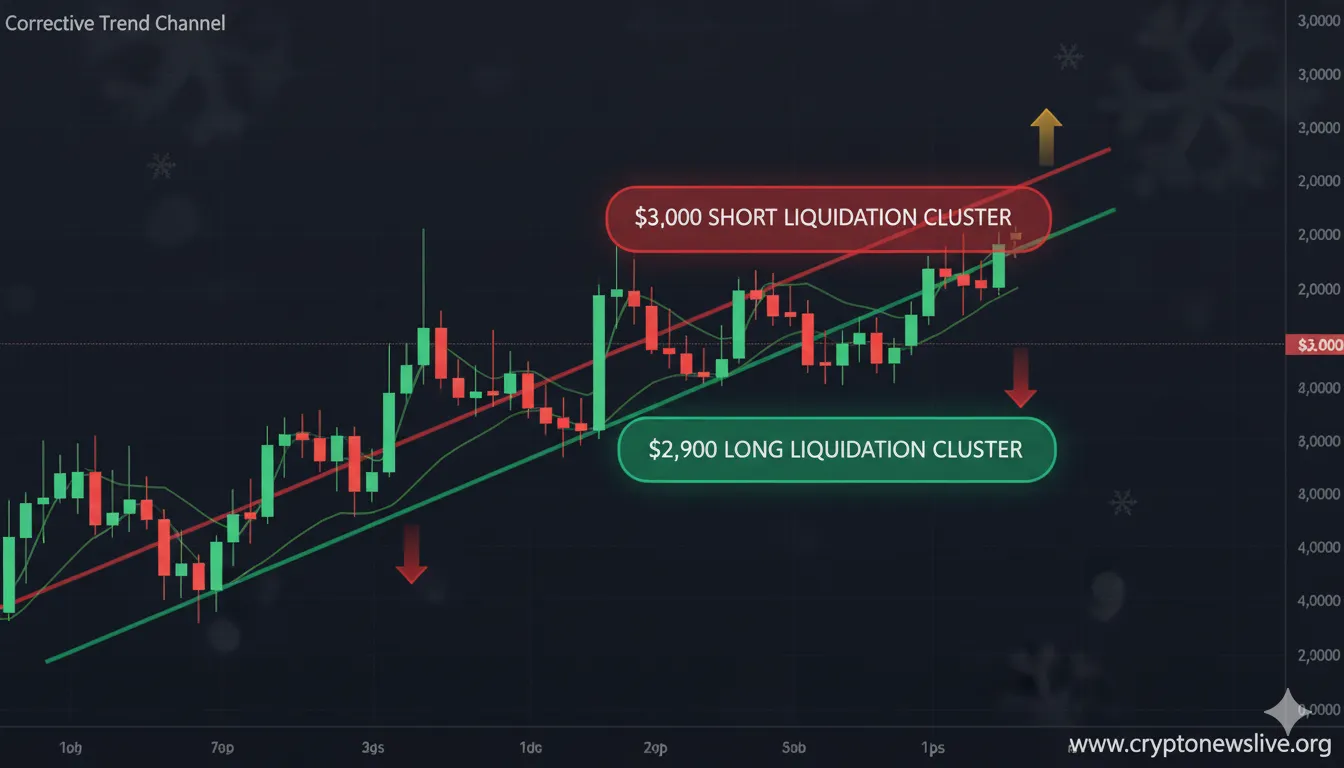
Ethereum remains confined within a corrective trend channel as traders monitor two critical liquidity zones at $3,000 and $2,900 that could determine the asset's next major move.
Ethereum's price action has entered a decisive phase as traders eye two key liquidity zones that could determine the asset's short-term trajectory. With the cryptocurrency stuck in a prolonged corrective pattern, market participants are questioning whether ETH will break above resistance or plunge to new lows.
The second-largest cryptocurrency by market capitalization has been trading within a restrictive corrective trend channel since late November, struggling to establish clear directional momentum. This consolidation phase has created a critical juncture where technical indicators suggest heightened volatility ahead.
Corrective Channel Confines Ethereum's Movement
According to Morecryptoonl on X, Ethereum remains trapped in a sideways corrective phase that commenced on November 21st. The digital asset continues trading below the upper boundary of its corrective trend channel, presenting a significant technical hurdle for bulls.
$ETH Ethereum remains in a sideways corrective phase that began on 21 November. Price is still trading below the upper boundary of the corrective trend channel.
The analysis emphasizes that breaking above this channel would provide the first meaningful indication that a substantial upside movement might be developing. However, even a successful breakout wouldn't guarantee sustained bullish momentum, as the advance could merely represent a B-wave within the broader corrective structure.
For genuine bullish credibility, Ethereum must reclaim the $3,550 resistance level. Until this critical threshold is breached, the probability of forming another low remains significantly elevated. Current market structure continues favoring either consolidation or additional downside pressure rather than an immediate breakout scenario.
Dual Liquidity Clusters Create Trading Battleground
The technical landscape becomes more intriguing when examining liquidity distribution. TedPillows noted on X that ETH currently features two distinct liquidity clusters that could trigger substantial price swings.
$ETH has 2 decent liquidity clusters right now. On the upside, there are short liquidations sitting around the $3,000 level. On the downside, there are long liquidations sitting below the $2,900 level.
Short liquidations are concentrated around the $3,000 mark, creating potential fuel for an upward surge if bulls can generate sufficient buying pressure. Conversely, long liquidations positioned below $2,900 present a magnetic target for bearish momentum. This dual-sided liquidity setup creates a classic trading range where either direction could trigger cascading liquidations.
The $100 spread between these liquidation zones represents a narrow battlefield where leverage traders have positioned themselves. Whichever level gets tested first will likely determine Ethereum's immediate directional bias and could spark significant volatility as leveraged positions get forcibly closed.
Market participants now face a waiting game to see which liquidity pool attracts price action first. The technical structure suggests that without a definitive breakout above channel resistance, the path of least resistance may lead toward testing lower support levels where long liquidations cluster.
** Key Takeaways:**
- Ethereum stuck in corrective channel since November 21st, trading below upper boundary resistance levels
- Critical $3,550 breakout needed for sustained bullish momentum, otherwise further downside remains probable
- Dual liquidity clusters at $3,000 and $2,900 create battleground for leveraged traders and volatility
#Ethereum #ETH #CryptoTrading #TechnicalAnalysis #Cryptocurrency
Stay updated on the latest cryptocurrency news on our homepage.
Explore more in Ethereum News Category.
Related reading:
Key Topics
Crypto New Live
admin@cryptonewslive.org
ETH's $3K Battle: Bulls vs Bears at Key Levels
Ethereum trapped in corrective channel since November faces critical test at $3,000 resistance with dual liquidity clusters threatening volatility ahead.