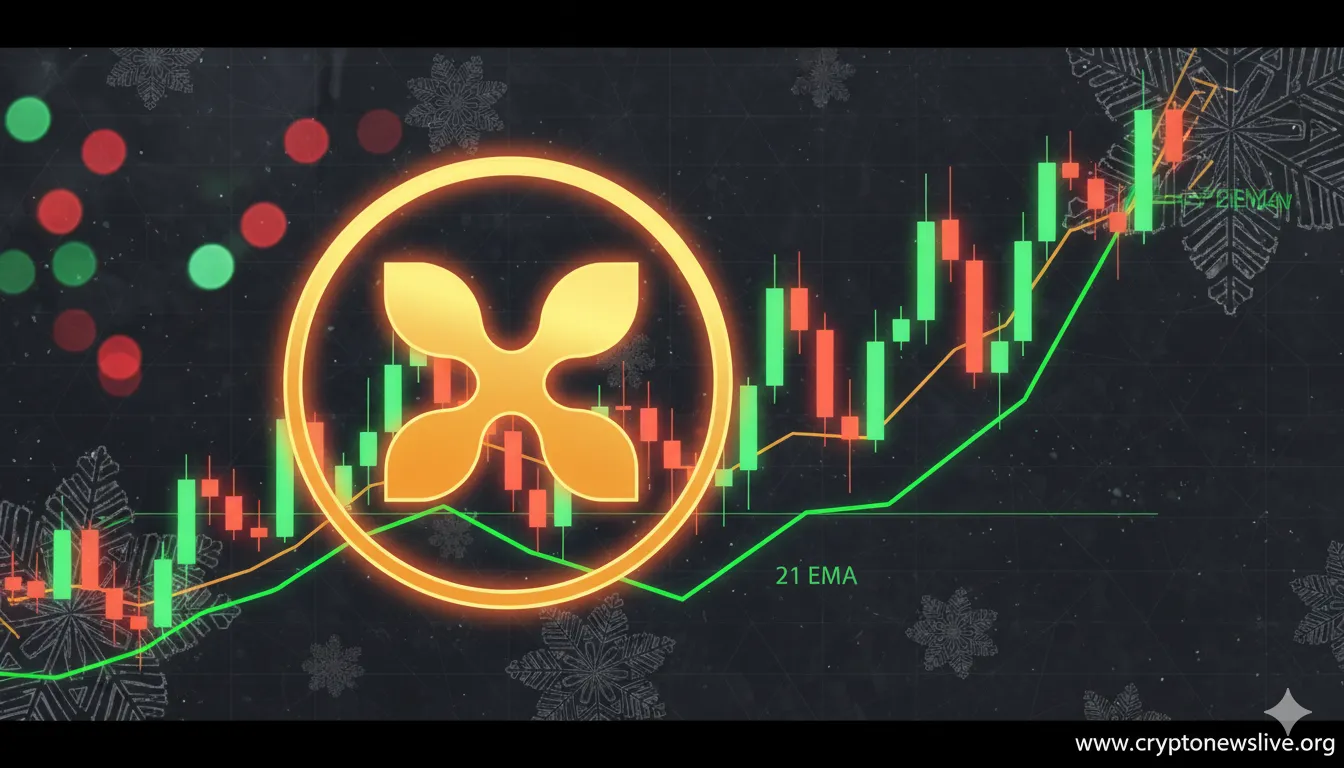
XRP has retested the 21-month exponential moving average, a crucial support level that previously sparked a 1,573% price surge. Trading at $1.86 after a 35% decline since October, the digital asset mirrors the exact pattern that preceded its explosive rally from $0.1977 to $3.31 in December 2017.
XRP has retested a crucial technical indicator that previously sparked an explosive 1,573% price surge. The digital asset currently trades at $1.86 after declining 35% since October 2025, but technical patterns suggest this downturn might be setting up another massive rally.
The cryptocurrency has returned to test the 21-month exponential moving average, a support level that has historically preceded dramatic upward moves. This same pattern emerged before XRP soared from $0.1977 to $3.31 between December 2017 and January 2018.
Historic Pattern Emerges at Critical Support
According to JD on X, XRP recently retested the pivotal 21-month EMA support, reminiscent of price behavior before the explosive surge in late 2017.
The current decline mirrors previous consolidation phases. After XRP reached $2.8 in September 2025, it collapsed alongside broader markets in October 2025. This downward pressure has persisted into December, pushing the asset below the psychologically significant $2 level.
The Crypto Basic noted on X that whenever XRP retests support at the 21-month EMA, the resulting move has been an explosive rally to new heights.
The pattern first appeared in December 2017 when XRP consolidated between March and December before retesting the 21 EMA support. The subsequent rally drove XRP from $0.1977 to $3.31, marking a 1,573% increase within weeks.
This identical setup repeated during the current market cycle. Following consolidation between $0.4 and $0.6 throughout 2024, XRP retested and briefly slipped below the 21 EMA in October 2024. The November 2024 U.S. elections then catalyzed an explosive move that pushed XRP to $3.4 by January 2025.
Multiple Technical Signals Align for Potential Rally
The correction throughout 2025 has kept XRP under bearish pressure, with occasional spikes including a July peak at $3.66. Despite persistent selling pressure, XRP remained above the 21-month EMA until the recent downturn finally pushed it below this critical support level.
According to The Crypto Basic's analysis on X, if XRP replicated even half of its December 2017 rise, it would surge 786% from current prices to reach $16.5.
This target would represent a new all-time high, though analysts emphasize the speculative nature of such projections. The pattern's consistency across multiple market cycles adds credibility to bullish expectations, but cryptocurrency markets remain inherently volatile.
Skipper, an XRP community analyst highlighted on X, found that XRP has consistently witnessed discouraging price action for at least 120 days before explosive surges in 2016 and 2024.
The current consolidation appears to follow this established timeline. With XRP now trading at critical technical support, traders are monitoring whether the pattern will complete as previous cycles suggest. The 21-month EMA has served as a reliable launchpad for major rallies, making this retest a focal point for technical analysts.
While historical patterns provide compelling evidence for potential upside, XRP's trajectory depends on maintaining support above the 21-month EMA. A sustained break below this level could invalidate the bullish setup and trigger further downside pressure.
The cryptocurrency faces a decisive moment. If XRP holds above the 21 EMA and follows historical precedent, the next several weeks could determine whether another explosive rally materializes. Past performance suggests significant upside potential, but traders remain cautious given the broader market's uncertain conditions heading into 2026.
Stay updated on the latest cryptocurrency news on our homepage.
Explore more in XRP News Category.
Related reading:
Key Topics
Crypto New Live
admin@cryptonewslive.org
XRP Eyes $16.5 After 1,573% Rally Pattern Emerges
XRP retests 21-month EMA support, mirroring the pattern that sparked a 1,573% surge in 2017. Analysts eye potential rally to $16.5 from current $1.86 level.