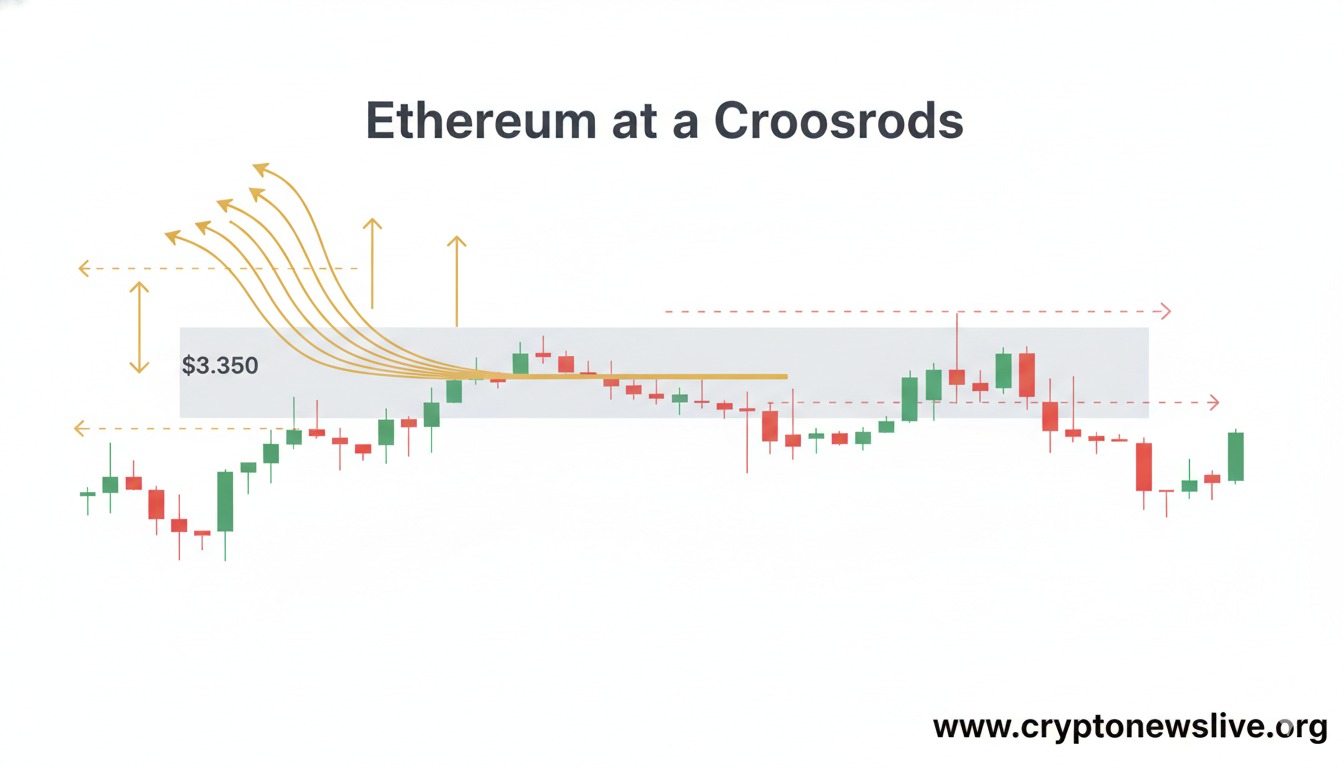
Ethereum confronts a pivotal technical moment as contrasting signals emerge. While some analysts identify parallels to gold's historic 142% breakout pattern, others warn of momentum fade through bearish candlestick formations at the $3,350 resistance zone.
Ethereum faces a pivotal moment as conflicting technical signals emerge. While some traders spot striking parallels to gold's historic breakout, others warn of momentum fade.
The second-largest cryptocurrency trades around $3,359, trapped between bullish patterns and cautionary indicators that could determine its near-term trajectory.
According to DaanCrypto on X, ETH has been rejected from its Daily 200MA/EMA and the $3,350 horizontal level. Despite this rejection, DaanCrypto notes that Ethereum has maintained relative strength compared to broader market conditions. The asset continues trending upward from November lows, though the path remains volatile and choppy. The trader emphasizes watching for higher highs and higher lows as critical directional indicators.
The price action reflects a market struggling to establish clear momentum. Bulls defend support zones while bears test resistance repeatedly. This standoff creates uncertainty about whether Ethereum can sustain its upward grind or faces deeper correction.
Historic Gold Parallel Sparks Five-Digit Predictions
MerlijnTrader on X draws attention to a compelling comparison between Ethereum and gold's price behavior. The trader highlights that ETH is repeating gold's breakout setup with a four-year range, fake breakout, and violent shakeout pattern. Gold experienced a 142% surge after establishing this configuration, and MerlijnTrader suggests Ethereum sits at the same trigger point.
The analysis warns that if ETH breaks through current resistance, late arrivals will miss the opportunity. This pattern recognition has gained traction among technical analysts who study historical price structures. The comparison suggests substantial upside potential if the pattern completes as gold's did.
Institutional demand and ETF inflows have sparked optimism that Ethereum could follow gold's legendary breakout pattern. The correlation between the two assets reached significant levels in recent quarters, driven by macroeconomic forces including inflation expectations and institutional product launches.
Multiple analysts project Ethereum could reach between $12,000 and $15,000 based on this pattern. The expanding adoption across DeFi and staking ecosystems adds fundamental support to the technical setup. However, Federal Reserve policy shifts could introduce volatility that disrupts the comparison.
Bearish Candlestick Formation Signals Caution
Contrasting the bullish gold comparison, alicharts on X points to a concerning technical development. The trader notes that Ethereum may be printing an evening doji star pattern, which traditionally signals fading momentum.
The evening doji star consists of three candlesticks that reveal shifting market sentiment. A large bullish candle shows buyer control, followed by a small-bodied candle indicating falling activity and indecision, then a bearish candle confirming seller pressure. This formation typically appears at local tops before reversals.
The same signal appeared at the peak of the 2021 bull market, preceding an 82% drawdown. Such patterns require confirmation through follow-through selling pressure. Without decisive bearish continuation, the signal may prove false.
The conflicting technical indicators create a critical decision point for traders. Some view current levels as accumulation zones before a major breakout, while others prepare for potential downside if bearish patterns confirm.
Market participants closely monitor Ethereum's ability to hold the $3,300-$3,350 range. A decisive break in either direction could set the tone for weeks ahead as bulls and bears battle for control at this technical crossroads.
Key Takeaways:
- Ethereum rejected at Daily 200MA and $3,350 resistance but maintains relative strength versus broader market
- Traders identify striking parallels to gold's four-year pattern that preceded 142% rally toward five figures
- Evening doji star formation warns of potential momentum fade similar to 2021 peak before 82% decline
#Ethereum #ETH #CryptoTechnicalAnalysis #TradingPatterns #CryptocurrencyNews
Stay updated on the latest cryptocurrency news on our homepage.
Explore more in Ethereum News Category.
Related reading:
Key Topics
Crypto New Live
admin@cryptonewslive.org
Ethereum's Critical Technical Crossroads
Ethereum faces conflicting signals as traders debate gold breakout pattern versus bearish evening doji star formation at critical $3,350 resistance level.