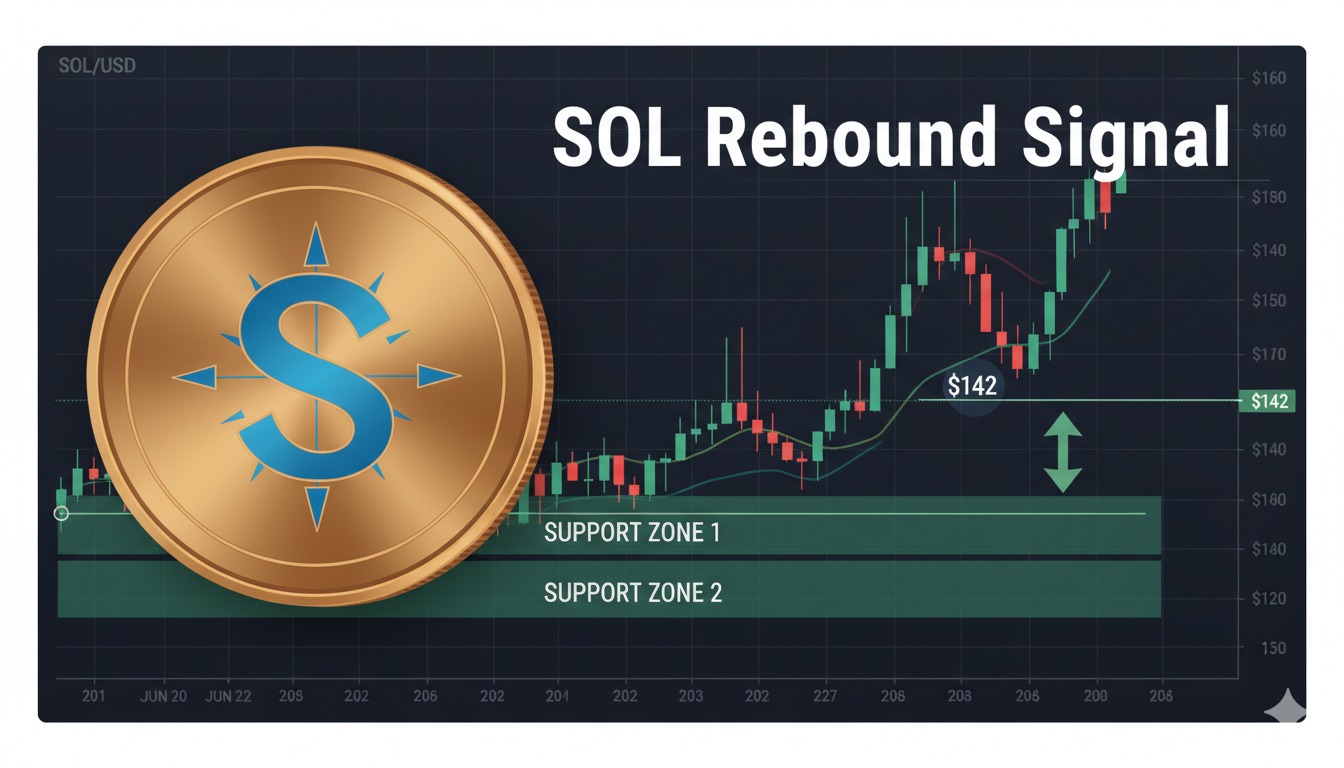
Solana’s TD Sequential buy on shorter timeframes signals a potential rebound near $142, facing crucial support between $136 and $139 and a pivotal $127 Elliott wave level.
The price of Solana is in the spotlight, with the price approaching the most important levels following a volatile week. Investors are expecting a strong turnaround.
Solana is currently trading marginally higher at 142.27, after having been on a downward spiral of 16% in a week, but is currently 0.79% up on a day-to-day basis.
The crypto currency is at a crossroad, with technical indicators suggesting that it can rebound in the face of sustained downhill pressure.
Fresh Buy Signal Ignites Short-Term Speculation
The TD Sequential indicator (usually used to indicate exhaustion in a downward trend) indicated a new buy signal on the 12-hour chart of Solana.
The signal was based on a finished red nine-count, which indicated an imminent recovery.
Solana is currently stabilizing within a sturdy support range of 136 to 139, an area that has held price declines and early adopters.
The most important level to keep an eye on is $142, and its increase would prove a new momentum, as Ali Martinez mentioned in social media.
In case Solana does not support the range of 136-139, the lower levels of 131 and 126 come into play, and buyers have a narrow margin to ensure that the price does not drop further.
Crucial Elliott Wave Levels Forecast Downside Risk
Structurally, the Solana Elliott wave has the key level at the $127 level. Holding over $127 will keep the core bullish argument alive, a drop would open up more corrections in accordance with Fibonacci numbers of around $117 and $106. The tightness of this upside threshold was pointed out in Man of Bitcoin.
The price of Solana is also near a thick Fibonacci support zone between $146 and 136, the support zone is constructed on the basis of the levels of the 0.786 and 0.887 retracement.
Related reading: Crypto Banks Face Major Setback as US Bank Lobby Demands License Delay
This zone has historically been a source of a strong reaction towards past downturns. However, the trend in momentum suggests the possibility of a liquidity sweep unless the resistance at $127 is maintained.
Volume Zones Define Possible Market Moves
On the weekly chart, Solana is drawing a high-volume support area of between 135 and 145, which is an important zone in price direction determination.
An extensive support zone is between $118 and 126; a crack at this level may reestablish market dynamics and open the way to a more vigorous advance.
The areas have been areas of strong reversals in the past that have been very critical in future price behavior.
CryptoPulse industry commentary notes that regardless of whether Solana rises or falls, there have been trading opportunities on both sides.
This moderate opinion implies that cautious positioning (via accurate volatility-trading instruments) may be beneficial.
Related reading: Morocco Unleashes Cryptocurrency—New Law Sparks Regional Fintech Surge
Key Topics
Crypto New Live
admin@cryptonewslive.org
Solana Eyes $142 Rebound Signal Amid Support Fight
Solana flashes TD Sequential buy signal near $142 amidst key support zones, with critical $127 level shaping next price move.