Crypto goes up because Bitcoin’s halving cycle cuts new supply every four years, institutional and retail demand grows against that tightening supply, and macro conditions like lower interest rates push capital toward risk assets. On-chain signals like falling exchange reserves and rising stablecoin supply amplify each move. The full breakdown of every driver is below.
Real Examples: Tokens That Rallied on Catalysts
See how specific catalysts drove real token rallies in our coverage:
• MAGMA jumped 49% on a confirmed PropAMM launch
• Lighter jumped 11% as Robinhood Chain went live
• Taiko doubled after bridge hack confirmed on-chain liquidity
• RE Token surged on Binance listing announcement
• zkPass bounced from all-time lows on developer updates.
Understanding why crypto goes up starts with one fact: no single force explains a rally. Bitcoin crossed $62,388 on June 7, 2026, with the total market cap sitting at $2.15 trillion according to CoinMarketCap. That recovery came after months of losses. The one-year chart for total market cap is still negative 33%. But the direction flipped, and the reasons why it flipped are the same reasons it has always flipped.
Crypto markets move in cycles driven by overlapping forces. Some are structural and repeat every four years. Some are cyclical and tied to global money supply. Some are behavioral and follow human psychology almost exactly. All of them matter.
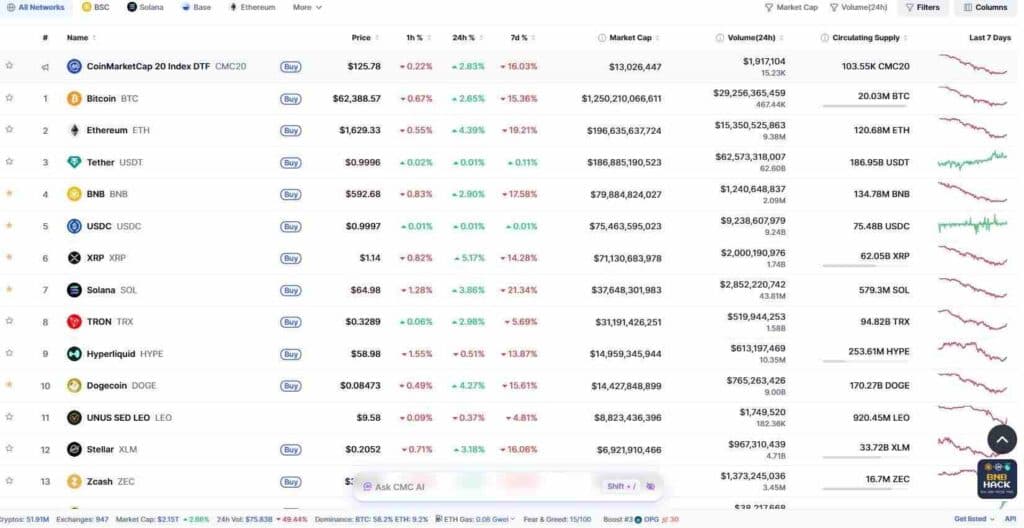
Top crypto prices on June 7, 2026. Bitcoin at $62,388, Ethereum at $1,629, XRP at $1.14.
Source: CoinMarketCap (coinmarketcap.com/charts/)
The Halving: The Most Predictable Driver
Bitcoin’s protocol cuts the reward paid to miners in half approximately every four years. This event is called the halving. It is written into Bitcoin’s code and cannot be changed. Every halving reduces the rate at which new Bitcoin enters circulation.
The most recent halving happened in April 2024. Miner rewards dropped from 6.25 BTC per block to 3.125 BTC. The next halving is projected for April 2, 2028, according to Bitbo’s halving tracker and Mempool.space data. That leaves roughly 1 year and 299 days from today.
Each prior halving was followed by a significant price increase within 12 to 18 months. The mechanism is basic economics. Less new supply with steady or growing demand pushes prices higher. Miners who survive a halving hold onto coins longer because selling at reduced production means lower revenue per block.
The halving does not cause an immediate spike. It sets the conditions. Prices typically grind upward over the following year as the reduced supply works through the system.
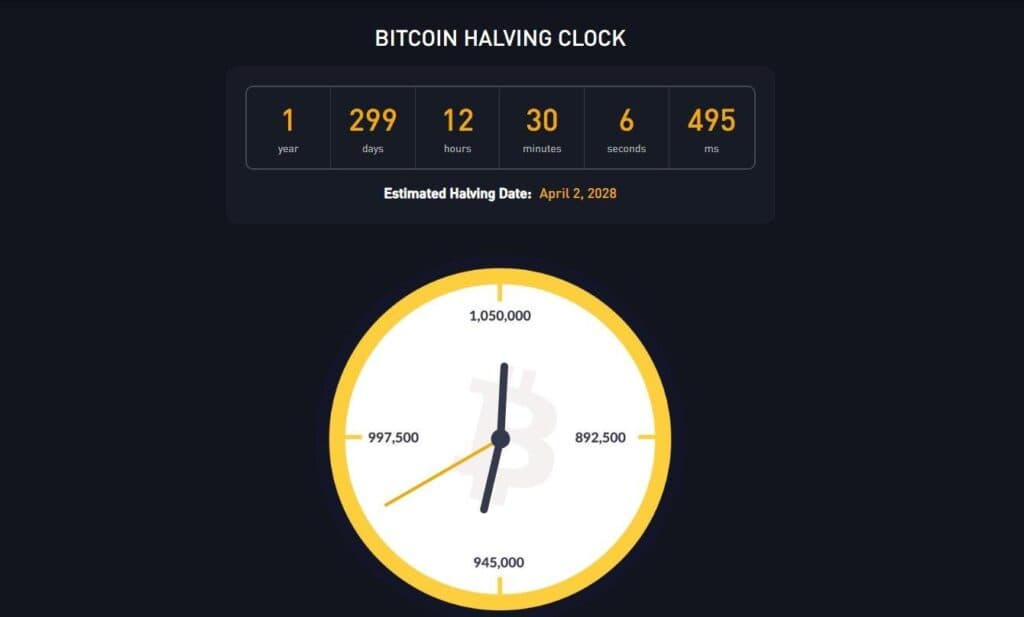
Bitcoin Halving Clock: next halving estimated April 2, 2028. Currently 1 year, 299 days away.
Source: Bitbo (bitbo.io/halving/)
Exchange Reserves Drop, Prices Rise
When Bitcoin moves off exchanges into cold storage or private wallets, available sell-side supply shrinks. The CryptoQuant exchange reserve chart shows exchange reserves fell from a peak above 3.2 million BTC to around 2.7 million as of recent data. That decline has been running for years.
The pattern is consistent across cycles. Exchange reserves peak near price tops, when holders are selling into strength. They bottom out during accumulation phases, when buyers are pulling coins off platforms. The current reading near 2.7 million BTC indicates a long-running accumulation trend.
Less Bitcoin available to sell on exchanges does not guarantee prices go up. But it does mean that when buying demand arrives, there are fewer coins available to absorb it. That imbalance is one of the clearest supply-side signals in on-chain data.
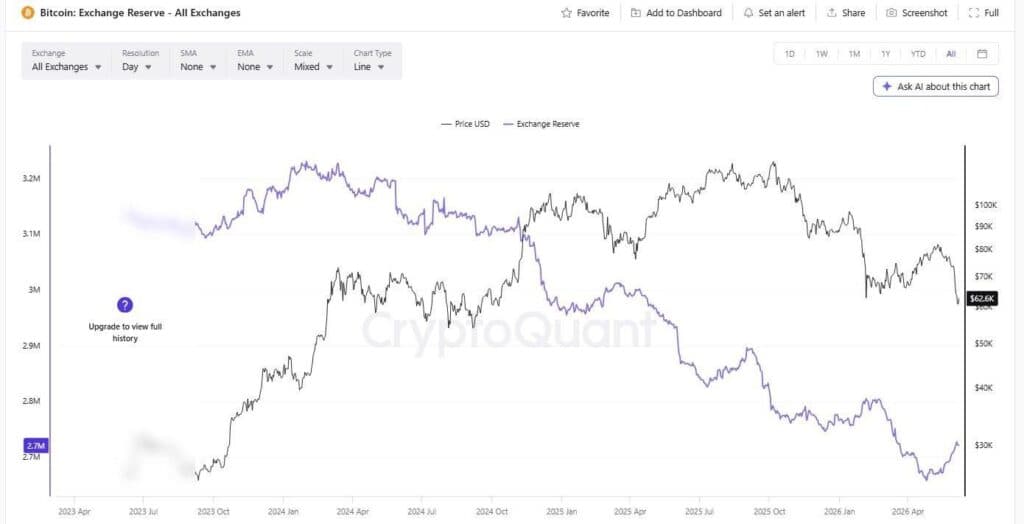
Bitcoin exchange reserves across all exchanges: fell from 3.2M BTC peak to ~2.7M BTC.
Source: CryptoQuant (cryptoquant.com)
Institutional Demand Changed the Structure
Spot Bitcoin ETFs launched in the United States in January 2024. They gave institutional buyers — pension funds, asset managers, family offices — regulated access to Bitcoin without direct custody. Coinglass ETF flow data shows that while daily flows fluctuate, the cumulative stock of Bitcoin inside these products represents a large and sticky demand base.
On June 5, 2026, total Bitcoin spot ETF net outflow was 5,100 BTC. BlackRock’s IBIT alone logged 3,350 BTC in outflows that day. Short-term outflows like that are normal. What matters structurally is that these products exist and that institutional buyers now have a low-friction path into Bitcoin.
Before ETFs, institutional allocations required OTC desks, custodians, and legal infrastructure most funds could not build. That barrier kept a large pool of capital out of the market. ETFs removed it. The structural demand base is permanently larger than it was before January 2024.
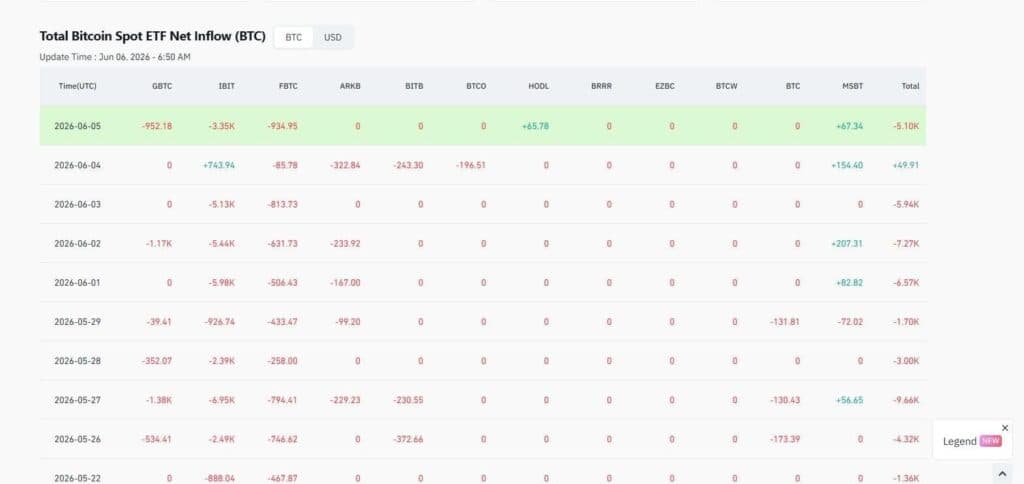
Bitcoin spot ETF net inflows by fund as of June 6, 2026. Net outflow of 5,100 BTC on June 5.
Source: Coinglass (coinglass.com/etf/bitcoin)
Macro Liquidity: The Tide That Lifts Everything
Global money supply and interest rate policy are the single largest macro force affecting crypto prices. When central banks lower rates or expand money supply, capital flows toward higher-risk, higher-return assets. Bitcoin and altcoins sit at the far end of that risk spectrum.
The Federal Reserve held rates steady at its April 28-29, 2026 meeting. The next FOMC decision is June 16-17, 2026, per the Federal Reserve calendar. Full meeting details are in the official April press release. A hold is not a cut, but it signals that the tightening cycle is not accelerating.
Rate hikes in 2022 and 2023 pulled capital away from crypto into yield-bearing instruments. That was the primary macro driver of the 2022 bear market. Rate holds and eventual cuts reverse that flow. The relationship is not perfectly timed but it is consistent across cycles.
Quantitative easing and money supply expansion work the same way. More dollars in the system searching for returns tend to find their way into Bitcoin. That is why total crypto market cap charts often rhyme with global M2 money supply charts.
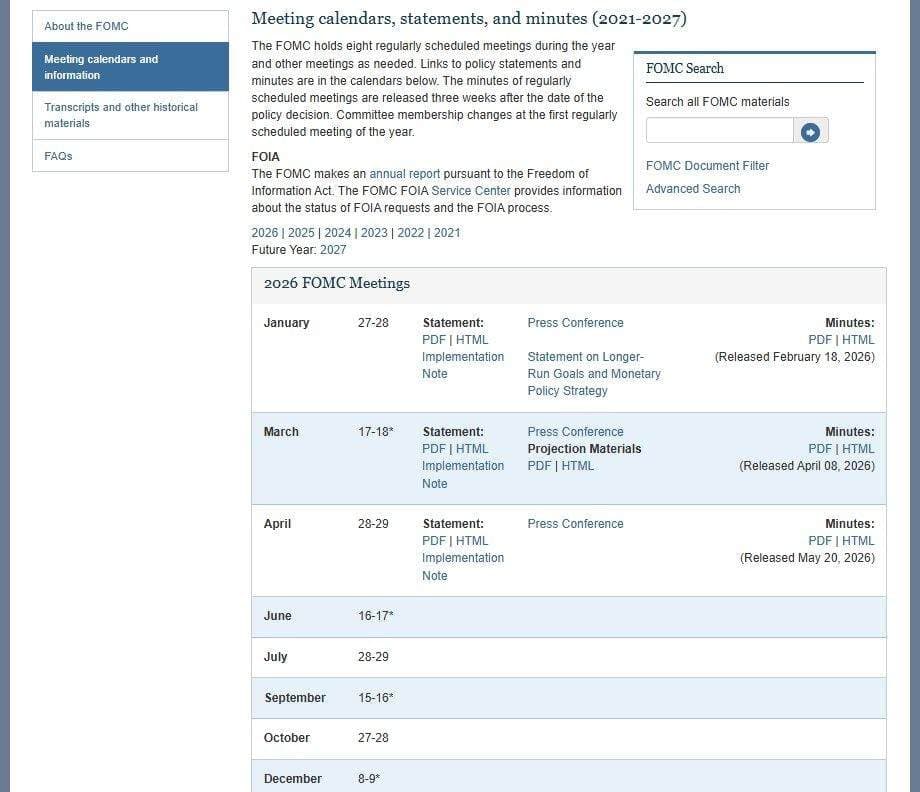
FOMC 2026 meeting schedule. Next rate decision June 16-17. April meeting held rates steady.
Source: Federal Reserve (federalreserve.gov/monetarypolicy/fomccalendars.htm)
Stablecoin Supply as Dry Powder
Stablecoin supply sitting on exchanges is one of the most underappreciated indicators of potential buying pressure. When traders and institutions hold large stablecoin balances — USDT, USDC, and others — that capital is parked and waiting. It can rotate into crypto within seconds.
Tether’s market cap sat at $186.9 billion as of June 7, 2026. USDC held at $75.5 billion, according to CoinMarketCap. That combined $262 billion in stablecoin supply represents potential buying power sitting one transaction away from entering the market.
When stablecoin supply grows, it often precedes a rally. Funds accumulate stable assets during uncertainty, then deploy them when confidence returns. The larger the stablecoin pool, the more fuel available for the next move upward.
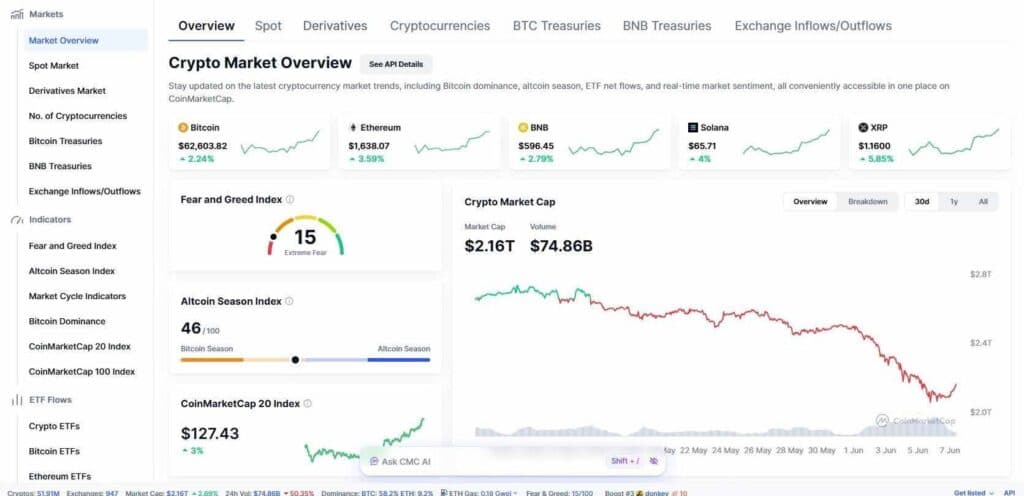
CoinMarketCap overview: market cap $2.16T, Fear and Greed at 15, Altcoin Season Index at 46.
Source: CoinMarketCap (coinmarketcap.com/charts/)
Bitcoin Dominance and the Altcoin Rotation
Bitcoin dominance measures Bitcoin’s share of total crypto market cap. The CoinMarketCap dominance chart shows Bitcoin holding 58.2% as of June 7, 2026. That is down from a yearly high of 65.1% on June 27, 2025.
The dominance cycle is a repeating pattern. Capital enters crypto through Bitcoin first. Bitcoin dominance climbs. As Bitcoin stabilizes or slows, capital rotates into altcoins seeking higher percentage gains. Altcoin Season Index rises. Then altcoins outperform and dominance falls further.
On June 7, XRP was up 5.17% on the 24-hour chart. Stellar gained 3.18%. Dogecoin rose 4.27%. Bitcoin itself was up 2.65%. Altcoins outperforming Bitcoin intraday is a standard early-rotation signal. The Altcoin Season Index sat at 46 out of 100. Still in Bitcoin territory, but trending away from the 65% dominance peak.
Understanding where dominance sits in its cycle helps explain which assets are likely to rally next. Early cycle: Bitcoin leads. Mid cycle: large-cap altcoins catch up. Late cycle: small-cap altcoins spike. That rotation has played out in 2017, 2020-21, and 2023-24.
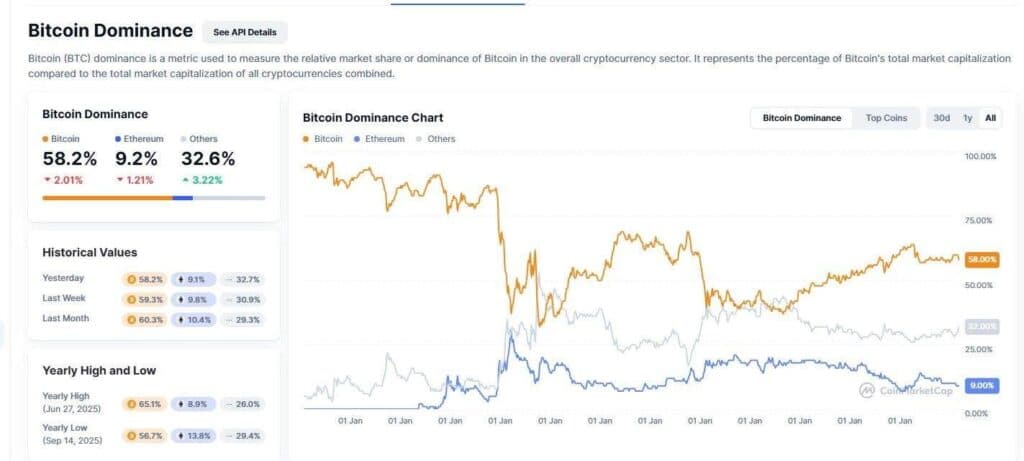
Bitcoin dominance at 58.2%, down from 65.1% yearly high. Ethereum at 9.2%, others at 32.6%.
Source: CoinMarketCap (coinmarketcap.com/charts/bitcoin-dominance/)
Sentiment Cycles and Extreme Fear as a Contrarian Signal
The Crypto Fear and Greed Index sat at 12 on June 7, 2026. Extreme fear. The same reading was 28 last week and 38 last month. Prices rose 2.95% on the same day the index read 12.
The Fear and Greed Index is a contrarian indicator. Extreme fear has historically preceded rallies more often than it has preceded further declines. When sentiment hits extreme lows, most sellers have already sold. The pool of potential sellers shrinks. That creates conditions where even modest buying demand moves prices sharply.
The reverse is also true. Extreme greed readings above 80 have preceded corrections in nearly every cycle. The index measures social media activity, volatility, momentum, surveys, dominance, and trading volume. It is not a trading signal on its own. But extreme readings at either end tend to mark turning points.
“In prior cycles, the periods of deepest fear while prices were recovering produced the highest forward returns for buyers who held through the noise.” — pattern documented repeatedly in on-chain research
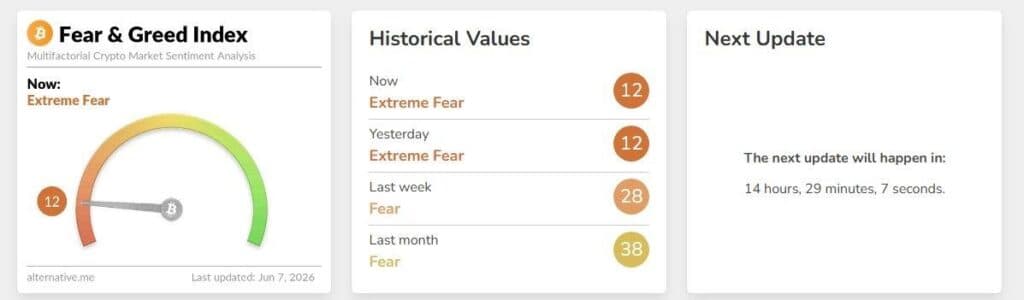
Fear and Greed Index at 12 (Extreme Fear) on June 7, 2026. One month ago it was 38.
Source: Alternative.me (alternative.me/crypto/fear-and-greed-index/)
Leverage, Open Interest, and Derivative Fuel
The derivatives market adds acceleration to moves in both directions. Open interest across perpetual contracts sat at $375.37 billion on June 7, 2026, with futures open interest at $3.23 billion, per CoinMarketCap data. When prices rise, leveraged long positions profit and traders add more leverage, which pushes prices further.
Funding rates in perpetual futures measure whether longs or shorts are paying to hold their positions. Positive funding means longs are dominant and paying shorts to stay in the market. That situation is self-reinforcing on the way up. Longs profit, add size, prices rise, more longs enter.
The unwinding of that leverage is also what makes crypto crashes fast and deep. When prices drop, long positions get liquidated, which creates sell pressure, which triggers more liquidations. Understanding the leverage cycle explains why crypto moves faster than almost any other asset class.
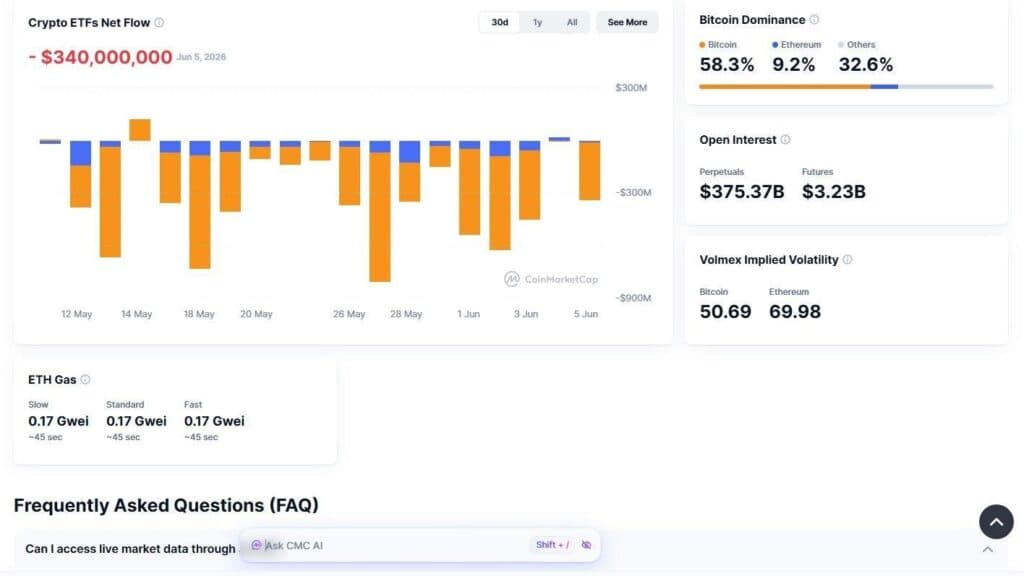
Crypto ETF net flows and Bitcoin dominance panel. ETF net flow -$340M on June 5.
Source: CoinMarketCap (coinmarketcap.com/charts/)
Network Adoption and Utility Growth
Long-term crypto price growth tracks network adoption. More users, more transactions, more developers building, more use cases in production. Ethereum’s $196 billion market cap is built on a network processing billions in DeFi volume, NFTs, Layer 2 activity, and tokenized assets daily.
Solana traded at $64.98 on June 7 with $2.85 billion in 24-hour volume. That volume reflects real usage. Transactions, swaps, NFT mints, and token launches. When networks see genuine usage growth, their native tokens tend to appreciate over multi-year periods.
Tron’s 24-hour volume hit $519 million that day, mostly from stablecoin transfers across its network. XRP’s volume reached $2 billion, tied to cross-border payment activity. Each of these is a real economic use case generating demand for the underlying asset.
For deeper context on why prices fall when these dynamics reverse, the guide at CryptoNewsLive covers the full mechanics of market declines including leverage liquidations, whale sell-offs, and macro tightening cycles.
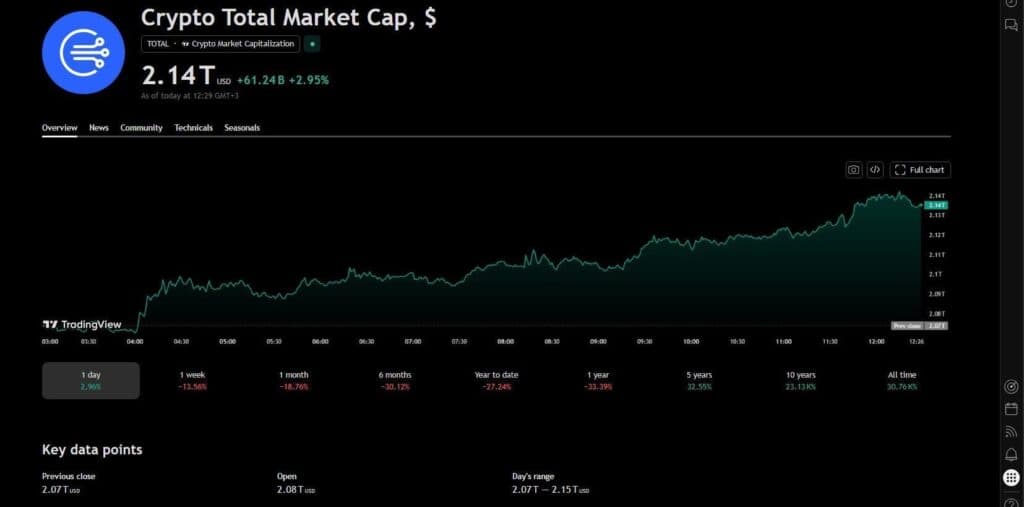
Total crypto market cap at $2.14T on June 7, 2026. Up 2.95% on the day, down 33% over one year.
Source: TradingView (tradingview.com/symbols/TOTAL/)
How These Forces Stack
No rally is driven by one thing. The 2020-21 bull run combined halving supply reduction, pandemic-era money printing, institutional entry via Grayscale products, DeFi adoption, and NFT retail attention all at once. Each force amplified the others.
The current setup entering mid-2026 shows post-halving supply compression still in play, exchange reserves near multi-year lows, institutional products with a large existing stock of Bitcoin, a Fed holding rates rather than hiking, and extreme fear sentiment creating a contrarian setup.
What is missing from the current picture is one or two of the larger accelerants: a major retail FOMO wave, a significant ETF inflow streak, or a clear rate cut signal from the Fed. Those are the catalysts that tend to compress months of gradual appreciation into weeks of sharp price moves.
Bitcoin’s Volmex implied volatility sits at 50.69. Ethereum’s is at 69.98. High volatility readings suggest the next large move is approaching. Direction depends on which set of forces arrives first.
Frequently Asked Questions
Why does crypto go up when the stock market goes up?
Risk appetite drives both markets. When investors feel confident, they allocate to higher-risk assets including equities and crypto. Low interest rates and strong macro data tend to lift both. Crypto often amplifies stock market moves because it sits at the higher end of the risk spectrum.
Does Bitcoin always go up after a halving?
Not immediately. The price effect of each halving has taken 12 to 18 months to fully materialize. The supply cut happens on a specific date but the market absorbs it gradually. All three prior halvings were followed by major price increases, though the timing and magnitude varied.
What causes altcoins to go up?
Altcoins typically rise when Bitcoin has already run and capital looks for higher-percentage returns. Falling Bitcoin dominance, rising stablecoin supply, and improving network metrics on specific chains are the main signals. Retail attention and narrative cycles around specific sectors — DeFi, AI tokens, Layer 2s — also trigger altcoin moves.
Can crypto go up during a recession?
It has before and it has not before. During the 2020 recession crypto rallied sharply because the Federal Reserve flooded markets with liquidity. In a recession where rates stay high and liquidity stays tight, crypto has historically struggled. The key variable is monetary policy, not the recession label itself.