
| Quick Answer If you searched why crypto down and landed here, the short answer is this: crypto prices fall because of a mix of forces that feed into each other. Rising interest rates pull money out of risky assets. Whale sell-offs trigger panic. Leveraged positions get force-closed. Often it is several of these at once. This guide breaks down each cause so you can read a market drop for what ## Real Examples: Tokens That Crashed on Risk Events See how specific risk factors drove real token declines in our coverage: • MemeCore: Promised $10M buyback but wallet still holds zero tokens • zkPass: Bounced 30% off all-time lows on liquidity concerns • YEI Finance: 56% of supply concentrated in one wallet, price fell 40% • Magma: Reversed 49% gain after PropAMM launch delays announced • Lighter: Lost 11% gains after Robinhood Chain performance issues. |
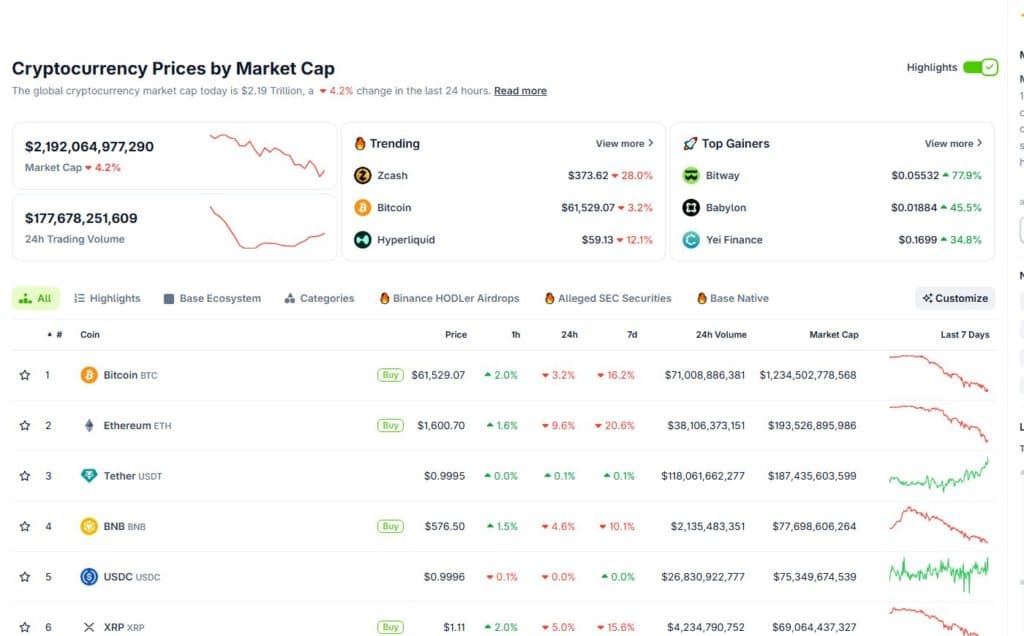
Crypto Market Overview: Bitcoin $61,529 (-3.2% 24h), Total Market Cap $2.19T (-4.2%) | Source: CoinGecko (coingecko.com) | Jun 5, 2026
1. Macro Economic Pressure
Crypto does not exist in a financial bubble. When the broader economy shifts, crypto markets feel it faster than most asset classes, and they fall harder.
That is the frustrating part. Nothing about the technology changes. No project breaks. The Fed adjusts rates by a quarter point, and suddenly why are crypto markets down is trending everywhere.
Interest rate changes
Higher interest rates move money from riskier assets into safer ones. Bonds, savings accounts, and Treasuries start looking attractive when they actually pay a return. Bitcoin pays nothing.
The Federal Reserve raised rates eleven consecutive times between March 2022 and July 2023, moving the benchmark from near 0 to 5.25-5.50 percent, according to official Federal Open Market Committee statements published at federalreserve.gov. Bitcoin fell from around $48,000 to roughly $16,000 during that window. Ethereum dropped from $3,900 to under $1,000 in the same stretch.
Not a coincidence. Higher rates strengthen the dollar, which then makes dollar-denominated crypto more expensive for international buyers. Demand shrinks. Prices follow.
Inflation and dollar strength
Crypto is priced in US dollars. A stronger dollar puts direct downward pressure on those prices because global buyers need more local currency to buy the same Bitcoin.
The US Dollar Index (DXY) tracked by the Federal Reserve shows this relationship clearly. When the dollar strengthens, Bitcoin often softens. When the dollar weakens, crypto markets tend to rise. It does not happen on a precise schedule, but the directional pattern repeats.
Recession fears
Fear of recession sends investors to cash and stable assets. Crypto, which has no dividends or revenue, suffers in risk-off environments. Every asset class tends to sell off during uncertainty, but crypto, with its higher volatility, usually drops further.
That is partly why crypto price drop events often match employment data releases or manufacturing reports. The asset class is still closely tied to risk appetite in traditional markets.
2. Bitcoin Leads, Everything Follows
One pattern repeats across every cycle. Bitcoin drops, and the rest of the market drops harder.
Why BTC dominance affects altcoins
Bitcoin is not just the largest asset in crypto. It anchors the whole market. Many altcoin pairs are denominated in Bitcoin, which means a BTC price drop reduces their dollar value automatically.
Bitcoin dominance, the percentage of total crypto market cap held in Bitcoin, is a useful early signal. When dominance rises sharply, money is fleeing altcoins for Bitcoin. When dominance falls, appetite for smaller coins is growing. CoinMarketCap publishes this figure daily at coinmarketcap.com.

Bitcoin Dominance (BTC.D) 2017-2024 | Data: CoinMarketCap (coinmarketcap.com)
The correlation problem
Unlike traditional markets, where stocks, bonds, and commodities can offset each other, most cryptocurrencies move in the same direction at once. Diversifying within crypto does not protect you the way diversifying across asset classes might.
During the 2022 sell-off, almost nothing in crypto avoided significant losses. Projects with strong fundamentals fell alongside weak ones. The correlation is structural, not temporary.
3. Regulatory News and Government Action
Regulatory headlines hit crypto markets before anyone finishes reading them. Traders sell first, then try to understand what was announced. This behavior makes regulation one of the fastest-moving catalysts for why crypto is falling on any given day.
Exchange crackdowns
When regulators move against an exchange, users panic. The fear of losing access to funds triggers immediate selling. It does not matter whether the legal case will succeed. The uncertainty is enough.
This has been documented in multiple enforcement actions published by the SEC at sec.gov, where formal charges against exchanges or related entities were followed by same-day price drops across the broader market.
Country-level bans
China banned cryptocurrency trading and mining multiple times between 2017 and 2021. The mid-2021 crackdown on mining operations sent Bitcoin from its April peak of $64,000 to around $31,000 by late May. That was a 44 percent drop from peak to trough in roughly six weeks.
No single country permanently ends crypto. But bans from major economies remove buyers, reduce liquidity, and push existing holders toward the exit.
SEC and legal uncertainty
The US Securities and Exchange Commission has filed enforcement actions against multiple crypto exchanges and token issuers. These cases are published openly at sec.gov/litigation. Each new action tends to create selling pressure across the market, not just in the targeted company.
Institutional investors are particularly sensitive to legal uncertainty. When the regulatory environment is unclear, capital stays out.
4. Whale Movements and Large Sell-Offs
Crypto markets are smaller than traditional financial markets. A single large holder moving a significant amount of coins can shift prices. These holders are called whales, and tracking them is possible because the blockchain is public.
How whale wallets move markets
A whale is any wallet holding enough crypto to move the market when they trade. When a whale sends a large amount of Bitcoin to an exchange, that transfer appears immediately on the public ledger.
Other traders see it and often assume a sell is coming. Their preemptive selling creates the very price drop the whale may have planned for. The public nature of the blockchain makes this dynamic self-reinforcing.
On-chain signals to watch
Two metrics help track what whales are doing. Exchange inflows measure how much Bitcoin is moving onto exchanges where it can be sold. High sustained inflows signal selling pressure. Glassnode tracks this data at glassnode.com, updated continuously.
The MVRV Ratio (Market Value to Realized Value) compares Bitcoin’s current price to the average price at which coins last moved on-chain. An MVRV above 3.5 has historically marked market tops. Below 1, it signals deep capitulation. This metric is available free at CryptoQuant (cryptoquant.com) and Glassnode.
5. Leverage and Liquidation Cascades
Leverage turns small drops into large crashes. The math is mechanical. It does not care about fundamentals.
What liquidations are
A liquidation happens when a leveraged position moves against the trader far enough that the exchange automatically closes it to recover the loan. A trader using 10x leverage is wiped out by a 10 percent adverse move. That forced closing adds selling pressure to an already falling market.
How one drop triggers a larger crash
A five percent Bitcoin drop liquidates leveraged long positions. That forced selling pushes prices down another five percent. More positions hit their threshold. More force-selling. More price drops. The technical term for this is a liquidation cascade.
May 2021 is the clearest example. Bitcoin fell from around $57,000 to $40,000. In the peak 24-hour window, over $8 billion in positions were liquidated across major exchanges, according to CoinGlass data at coinglass.com. The cascade amplified a moderate drop into a much larger one.
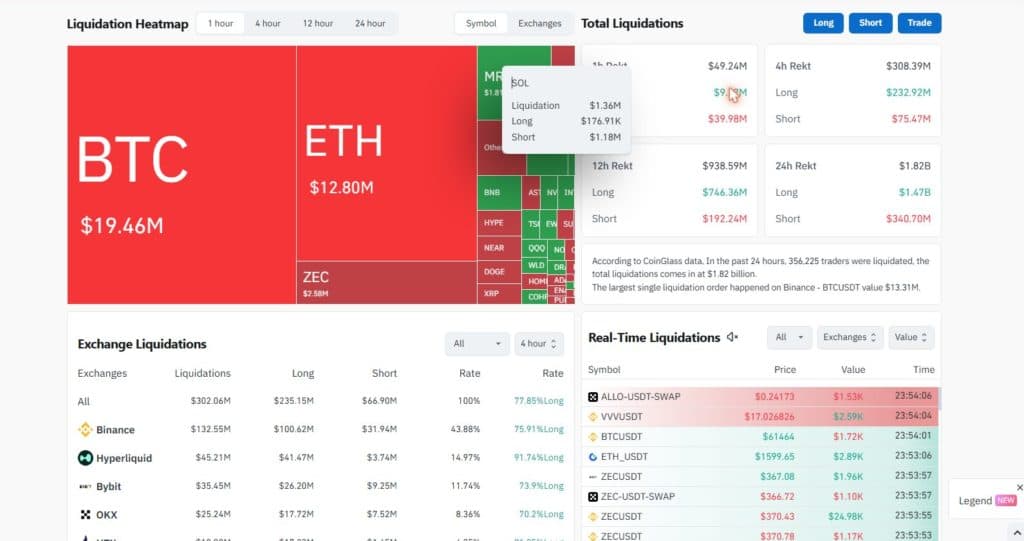
Liquidation Heatmap | Source: CoinGlass (coinglass.com) | Live data, Jun 5, 2026
6. Sentiment, Fear, and Social Media
Crypto prices are unusually sensitive to emotion. No earnings reports anchor valuation. No dividend stream provides a floor. Narrative and sentiment fill that gap, which is why social media moves this market in ways it cannot move equities.
The Fear and Greed Index explained
The Fear and Greed Index runs on a scale from 0 (Extreme Fear) to 100 (Extreme Greed). It is maintained by Alternative.me and updated daily at alternative.me/crypto/fear-and-greed-index.
The index draws from five inputs: price volatility, trading volume, social media activity, Bitcoin dominance, and Google Trends data. Volatility and trading volume each carry 25 percent weight.
When the index sits below 25, the market is in extreme fear. Historically, that has coincided with market bottoms, not further crashes. When it moves above 75, a correction has typically followed. It does not predict exact turning points. It does give context for whether sentiment is driving prices more than fundamentals.
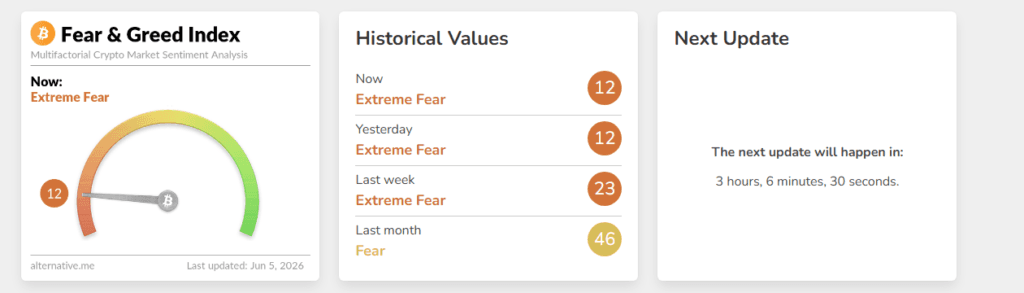
Crypto Fear and Greed Index: Extreme Fear (12) | Source: Alternative.me (alternative.me/crypto/fear-and-greed-index) | Jun 5, 2026
How Twitter/X and Reddit move prices
A single post from a prominent account can move Bitcoin by double digits in minutes. Reddit communities like r/CryptoCurrency and r/Bitcoin amplify both panic and euphoria.
During the 2021 bull market, social platforms drove retail demand to extreme levels. When sentiment flipped, the same channels accelerated the sell-off. Unverified negative news travels faster than corrections. Prices often overshoot on the downside before recovering.
7. Exchange Problems and Black Swan Events
Even investors who understand macro, whale behavior, and leverage get caught by black swan events. These are high-impact shocks the market has not priced in. They account for some of the steepest drops in crypto history.
Exchange hacks and collapses (FTX as example)
FTX was the world’s second-largest crypto exchange by volume. In November 2022, investigative reporting revealed its balance sheet was built largely on its own illiquid token. A bank run followed. FTX froze withdrawals and filed for bankruptcy within a week.
Bitcoin fell roughly 25 percent in days, dropping from around $21,000 to below $16,000. Total crypto market cap fell by an estimated $200 billion dollars. The FTX bankruptcy proceedings are public record in US Bankruptcy Court for the District of Delaware (case 22-11068).
An earlier parallel: the Mt. Gox hack in early 2014 drained approximately 850,000 Bitcoin from the exchange. Bitcoin fell from over $800 to below $300 and did not recover for over two years.
Stablecoin de-pegs
Stablecoins are supposed to hold a fixed value, usually $1. When they fail, the damage spreads across the entire market.
TerraUSD (UST) lost its peg in May 2022. Its algorithmic mechanism failed. UST and its companion token LUNA collapsed near zero within days. Bitcoin dropped approximately 30 percent during that same period as panic spread across DeFi protocols and centralized exchanges. Stablecoins sit at the foundation of crypto liquidity, so a de-peg creates structural damage far beyond one project.
8. Is This a Temporary Dip or a Longer Bear Market?
Not every drop turns into a bear market. The distinction matters a great deal for how you respond.
Historical recovery timelines
Three examples show the range of what crypto market crash events can look like.
March 2020, COVID crash: Bitcoin fell from around $10,000 to under $4,000. A drop of roughly 60 percent. It recovered fully within six months as central banks injected massive liquidity.
May 2021, mid-cycle correction: Bitcoin fell from the April 2021 peak of $64,000 to around $31,000. A 44 percent drop. New all-time highs came by November 2021, just six months later.
2022 bear market: Bitcoin fell from approximately $68,000 in November 2021 to roughly $15,500 by November 2022. A drawdown of about 77 percent. Three separate catalysts hit simultaneously: Fed rate hikes, the Terra collapse, and the FTX bankruptcy.
Based on historical data covering four complete cycles, crypto bear markets have run between 12 and 14 months on average. The 2014-15 bear lasted about 14 months. The 2018-19 bear ran 12 months. The 2022-23 bear lasted roughly 13 months. Recovery to previous all-time highs has typically needed another two to three years from the bottom, according to research published by Kraken (kraken.com/learn/crypto-bull-bear-markets).

Bitcoin Bear Market History: Drawdown and Duration by Cycle | Data: Glassnode (glassnode.com), Kraken Research
On-chain metrics to assess the situation
MVRV Ratio: When this falls below 1, most Bitcoin holders are sitting at a loss. That condition coincided with bear market bottoms in 2015, 2018, and 2022. When it rises above 3.5, the market is historically overvalued and a correction often follows. Track it free at Glassnode (glassnode.com) or CryptoQuant (cryptoquant.com).
Exchange inflows: When large volumes of Bitcoin move onto exchanges, sell pressure is building. When outflows dominate, meaning coins are moving into private wallets, that signals accumulation and reduced sell pressure. CoinGlass (coinglass.com) and CryptoQuant publish both metrics for free in real time.
What Should You Do When Crypto Is Down?
The biggest risk when prices fall is emotional decision-making. Here is a practical framework.
Revisit your original reason for buying. If that reason has not changed, a price drop does not automatically make selling correct. Most retail investors who lock in losses do it at the bottom, not the top.
Check your exposure. If a drop in crypto would meaningfully damage your financial situation, you are probably overexposed relative to your risk tolerance. Position sizing is more important than market timing.
Avoid leverage during high volatility. This is where the majority of retail trading losses happen. Liquidation cascades move faster than anyone can react. Borrowed positions do not care about conviction.
Use data. Check the Fear and Greed Index at alternative.me, review exchange inflows on CryptoQuant, and look at the MVRV Ratio before making major decisions. Headlines amplify panic. On-chain data tends to be more objective.
Disclaimer: Nothing in this article is financial advice. Crypto markets are volatile and unpredictable. Before making significant investment decisions, speak with a licensed financial professional familiar with digital assets.
Frequently Asked Questions
Q: Why does all crypto go down at the same time?
A: Most cryptocurrencies trade within the same risk asset class. Many altcoin pairs are denominated in Bitcoin. When Bitcoin falls, those pairs automatically lose dollar value. The correlation is structural. Very few assets within crypto are genuinely independent of Bitcoin’s price movement.
Q: Does crypto always recover after a crash?
A: Bitcoin has recovered from every major crash and reached new all-time highs. Individual altcoins have not always done the same. Many projects from the 2017 and 2021 bull markets failed entirely during the following bear markets. Recovery timelines for Bitcoin have ranged from six months after the 2020 COVID crash to roughly three years following the 2017-18 cycle top. Past performance does not guarantee future results.
Q: What causes a crypto market crash?
A: Crashes typically involve overlapping triggers. Rising interest rates from central banks pull money out of risky assets. Regulatory enforcement actions from bodies like the SEC create selling pressure. Exchange failures and stablecoin de-pegs trigger panic. Whale sell-offs reduce liquidity. Leverage cascades amplify whatever drop is already happening. The worst crashes involve several of these at once.
Q: How long do crypto bear markets last?
A: Historical data from four complete cycles puts the average between 12 and 14 months from peak to trough. The 2014-15 bear lasted 14 months. The 2018-19 bear ran 12 months. The 2022-23 bear lasted 13 months. Full recovery to previous all-time highs has taken an additional two to three years in most cases, though macroeconomic conditions and the nature of the triggering event affect timing.