Ethereum is falling. The staking queue keeps filling. That contradiction is now impossible to ignore.
Spot price on Binance dropped to $1,657.60 on June 14, a fresh multi-month low that has caught the attention of traders watching the weekly chart. Yet underneath that decline, on-chain behavior tells a different story entirely.
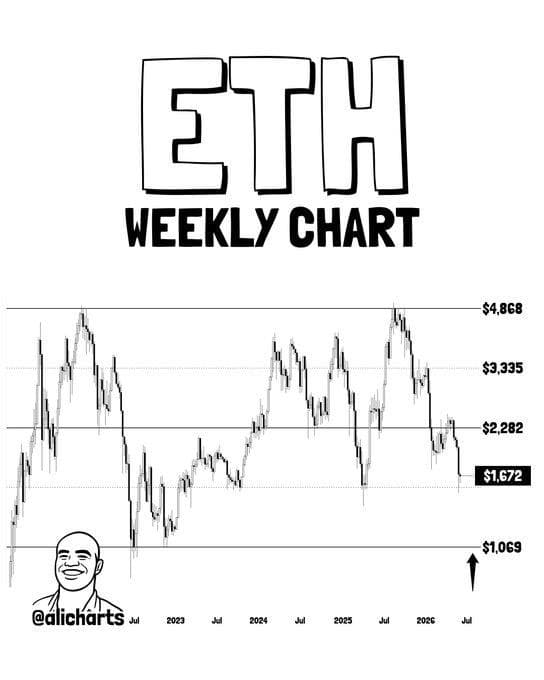
ETH weekly chart via @alicharts on X, showing the multi-year channel with $1,069 as the lower structural support.
What the Weekly Chart Is Saying
Prominent chart analyst @alicharts posted the ETH weekly chart on X, pointing to a multi-year channel structure that dates back to the 2022 lows. The analysis is blunt.
“If Ethereum $ETH revisits $1,070, I believe it would present one of the best buying opportunities on the chart, according to this multi-year channel pattern.” — @alicharts, June 2025, on X
That $1,070 level sits at a lower channel boundary that has historically marked cycle bottoms. At current levels around $1,657, ETH trades well above it, but the direction of price action over the past three weeks is pointing south. The channel structure has not broken.
Lower highs. Lower lows. The short-term trend is bearish, and the weekly chart makes that plain.
39.7 Million ETH Locked While Price Breaks Down
This is where the chart and the chain start to disagree. Total staked ETH has climbed past 39.7 million, up from around 36 million when ETH was trading near $3,400, according to CryptoQuant data. The staking ratio now sits at 32.48%, meaning nearly one third of circulating supply is locked and unavailable for sale.
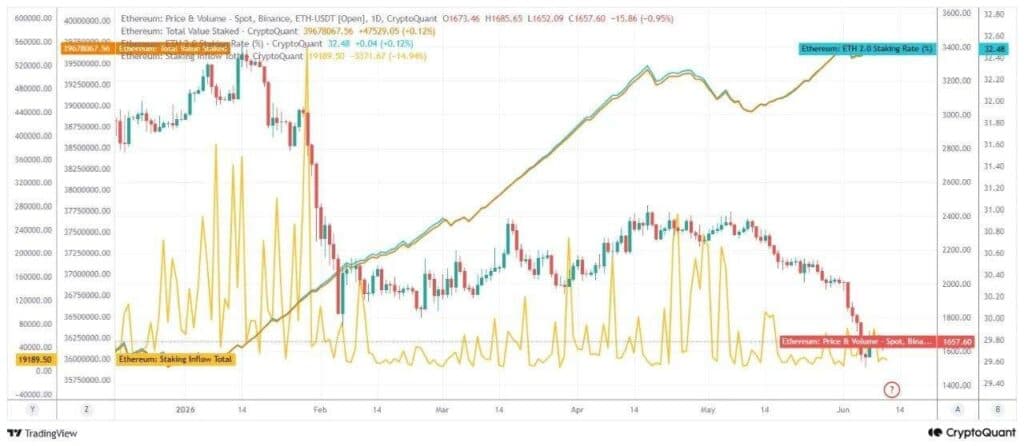
Ethereum staking rate vs price chart via CryptoQuant. Staked ETH rises even as price declines from $3,400 toward $1,657.
A CryptoQuant analyst writing on the platform noted the divergence directly: staked ETH keeps climbing while price keeps falling. In the analyst’s view, such a pattern rarely holds indefinitely. Either demand catches up with the accumulation and price recovers, or macro pressure extends the pain further.
Staking inflow has remained steady, with no significant withdrawal wave visible in recent data. If long holders genuinely expected the price to fall much further, the staking ratio would likely show exits. Instead it keeps rising.
The liquid supply of ETH on exchanges is contracting as a result. Fewer coins available for trading can amplify any future price move in either direction. For a Kenyan trader holding ETH on OKX P2P and watching the daily chart, that compression matters. It means the recovery, when it comes, could move faster than the descent.
A Divergence That Cannot Last
The data from Staking Rewards confirms a 30-day net increase of 705,000 ETH staked even as ETH’s price fell nearly 30% over the same period. A total of 781,842 active validators are now staking on the network as of mid-June, generating an estimated $2 billion in annual staking rewards.
Those numbers do not behave like a crowd preparing to sell. They look more like a crowd that has already decided the price is wrong.
Still, the CryptoQuant analysis carries a clear warning. Price action continues to show lower highs and lower lows. A confirmed bottom has not formed. The short-term trend is bearish regardless of what staking data suggests, and macro pressure from delayed Federal Reserve rate cuts and weak ETF inflows has not eased.
If ETH fails to hold $1,600, a retest of $1,400 or lower becomes possible. The channel structure @alicharts identified places $1,069 as the deepest structural support. Nothing in the on-chain data rules that out.
What Long-Term Holders Are Actually Doing
The CryptoQuant analyst published a view that sits between the two extremes. ETH may be approaching a bottoming phase. The steady rise in staked ETH suggests on-chain selling pressure is not building. A gradual consolidation and recovery appears more probable, in the analyst’s assessment, than an accelerated sell-off over the next few weeks.
That is not a price call. It is a read on behavior. Long-term holders are not acting like people who are scared. They are acting like people who are waiting.
The fastest price reactions typically happen on Binance, where whale and institutional flows concentrate. Binance spot data shows ETH opened at $1,673.46 on June 14 and hit an intraday low of $1,652.09 before settling around $1,657. Volume remains below levels seen during the February peak.
Whether that waiting turns into a catalyst depends on what the macro environment does next. The staking data is structurally bullish. The price chart is not. Right now, both things are true.