The HYPE token is sitting at a technical inflection point. Price has pulled back sharply from its all-time high of $75.63 recorded in early June 2026, and the 4-hour chart is now tracing what looks like a right shoulder in a head and shoulders formation. The neckline sits around $54.
Two chart setups. One token. Completely opposite conclusions depending on where you anchor your read.

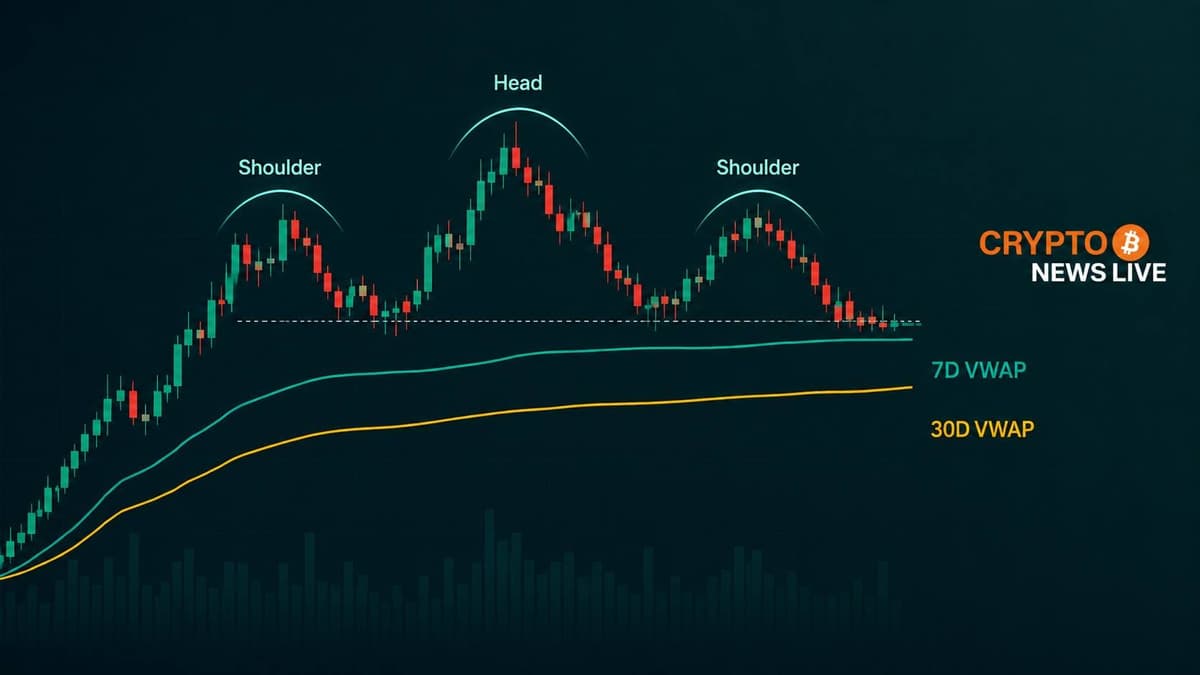
The Pattern Nobody Wants to Own Right Now
As alicharts posted on X, HYPE is shaping what looks like the right shoulder of a head and shoulders pattern on the 4-hour timeframe. The $65 level is the immediate resistance wall. A clean break below $54 would confirm the structure and open the floor to considerably lower levels.
The chart shows a head printed at $75.63, a left shoulder carved earlier in May, and the current right shoulder forming between $60 and $65. The neckline at $54.61, if it cracks, points toward $48 and beyond that $40.66, based on the measured move projection visible in the chart.
On-chain context adds weight to that concern. Futures open interest dropped to approximately $5.86 billion as of June 10, 2026, per data tracked by crypto.news, as long positions were wiped out during the correction. A $700 million token unlock on June 6 released nearly 9.9 million HYPE tokens into circulation, adding direct sell-side pressure at a moment when the chart was already showing fatigue.
The unlock coincided with profit-taking from early investors who had ridden the May rally. That is the kind of supply wall that makes right shoulders look heavier than they are.
But the VWAP Is Holding
Here is the part most bearish coverage is skipping. As swarmister noted on X, HYPE is still holding above the 7-day and 30-day rolling volume-weighted average price. That is not a minor detail. VWAP reclaims after corrections in strong assets tend to act as a floor, and the sustained hold above both timeframes points to buying pressure that is still absorbing the sell-off.

The primary target swarmister is watching is $64, with the daily fair value gap between $66 and $68 as the more optimistic destination. He posted on X: “It’s holding above the 7D/30D RWVAP, which is a huge strength in my view… my main target is $64. However, if we’re more optimistic, we have the D1 FVG in the $66-$68 range; these targets will definitely be reached.”
The trader flagged a planned exit at $64, where he intends to close 70% of his position. From there, he is watching for a correction before buying back in at 50%, though he noted that call will be made based on market reaction at the time.
Where Retail Traders in Emerging Markets Stand
For a Kenyan crypto trader watching HYPE via OKX or a similar exchange, the split setup demands a clear line in the sand. The $54 level is not just a chart point. It is the decision gate.
If HYPE holds above $54 and pushes through $65, the VWAP thesis plays out and the head and shoulders pattern fails to confirm. That is the scenario swarmister is positioning for, with a staged exit near $64 and a re-entry plan on any pullback from that zone.
Lose $54 and the measured move from the pattern puts $40 on the table. Altcoin Sherpa, an independent analyst, wrote on X on June 9 that losing $54 would likely push HYPE into a gap fill between $44 and $54, and that even in that scenario he considers the asset structurally sound over the long run.
What the Charts Are Not Telling You
Arthur Hayes, the co-founder of BitMEX, reportedly accumulated 130,000 HYPE tokens after exiting his position earlier, according to on-chain tracking data circulating on June 10. That is a reversal worth noting. A large buyer stepping in near current prices does not confirm a bottom, but it does change the weight of the bearish thesis.
The head and shoulders structure is textbook. The VWAP hold is real. Those two things can coexist until they cannot, and the moment of resolution is $54.
Watch the weekly close. If HYPE prints a candle body above $60 heading into the weekend, the right shoulder is still being built and the bull case remains alive. If volume spikes on a move under $55, the pattern is closer to confirmation than the chart currently suggests.