$BTC is sitting almost exactly where a coin flip would leave it. Bitcoin traded at $78,978 on Monday, up 2.2% on the day, after a 24-hour range of $76,439 to $79,291. Friday’s rally toward $80,000 got sharply rejected, and the price has spent the weekend bouncing off the same zone it broke through weeks ago.
That alone would be a quiet Monday. It isn’t one. A drone attack on a Saudi pipeline has pushed oil above $100 a barrel for the first time in months, U.S. stocks opened the week lower, and the Senate is one procedural vote away from deciding crypto’s regulatory future. All of it is landing in the same 96 hours.
The Chart Is a Coin Toss
Bitcoin’s daily chart shows a market that genuinely does not know which way it wants to go. Price is wedged between a green support zone in the mid-$70,000s and a red resistance band just under $90,000, with the former resistance around $76,700 now acting as support.
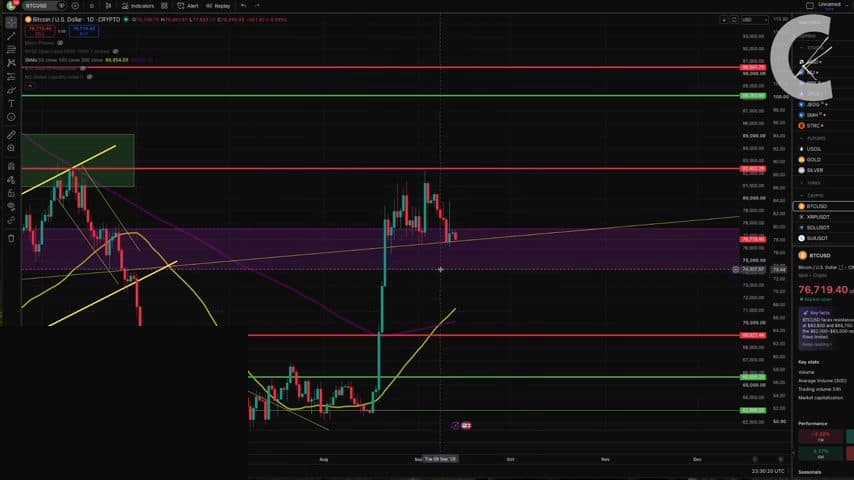
That flip, resistance becoming support, is usually a bullish signal. But the move up from it has stalled inside a narrow channel, which is exactly what happens when buyers and sellers are fighting to a draw rather than one side winning outright.
The Derivatives Data Backs It Up
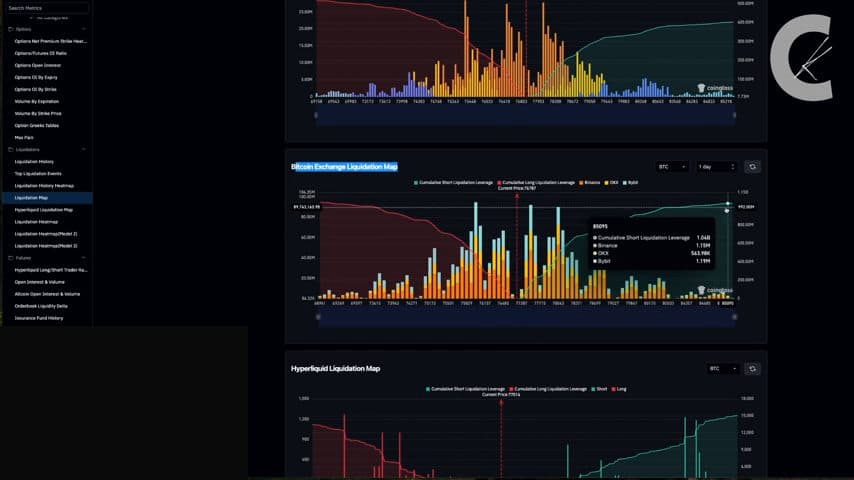
The positioning data confirms the chart isn’t lying. Over the past 30 days, cumulative short liquidation leverage across major exchanges sits at roughly $1.04 billion, barely different from the long side. It’s about as close to dead-even as leverage data gets.
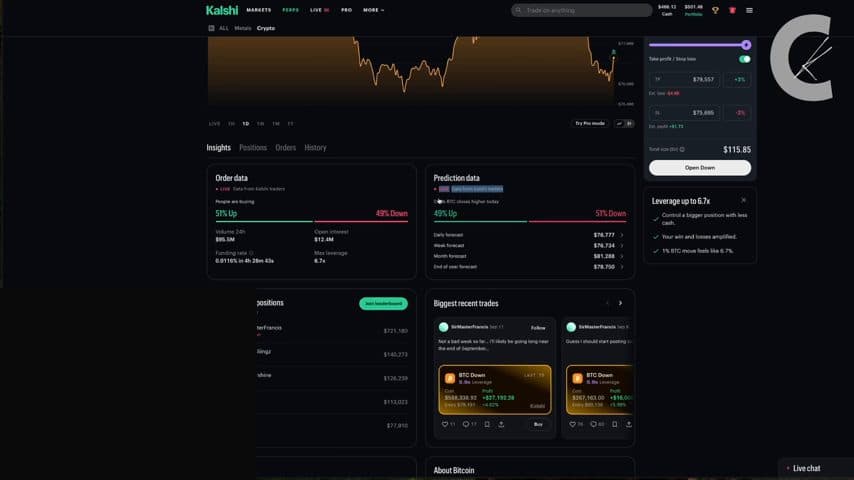
Prediction markets tell the same story. On Kalshi’s live “Will BTC close higher today?” market, traders are split 49% up versus 51% down, about as close to a coin flip as a real-money market gets.
The Crypto Fear & Greed Index reads 57 today, in “Greed” territory but down from 61 a day earlier, according to Alternative.me’s own data. Sentiment is leaning bullish, even if positioning isn’t picking a side yet.
A Saudi Pipeline Just Went Dark
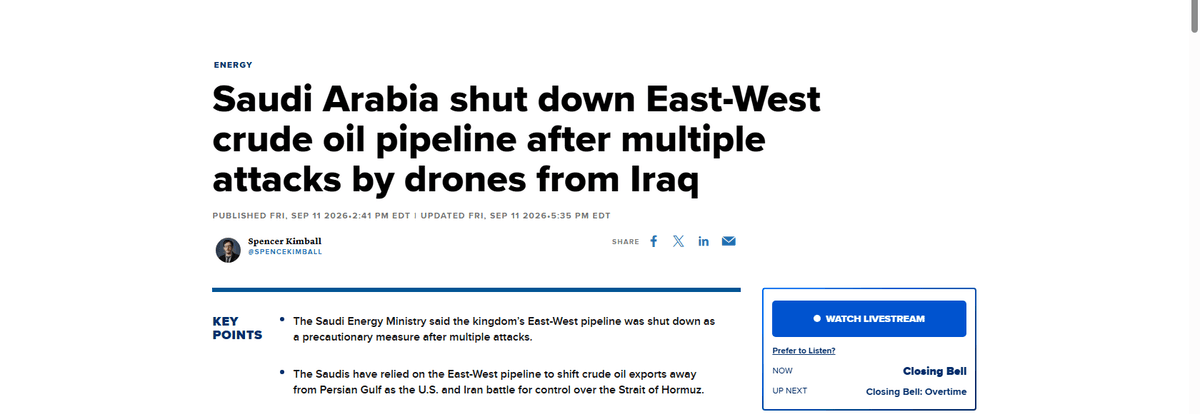
The bigger story this week isn’t on a crypto chart at all. Saudi Arabia shut down its East-West crude pipeline on September 11 after multiple drone strikes launched from Iraqi territory hit pump stations, according to CNBC. The pipeline normally moves up to 7 million barrels a day to the Red Sea, and Saudi Arabia had been leaning on it precisely because the Strait of Hormuz has been effectively closed off by the ongoing Iran war.
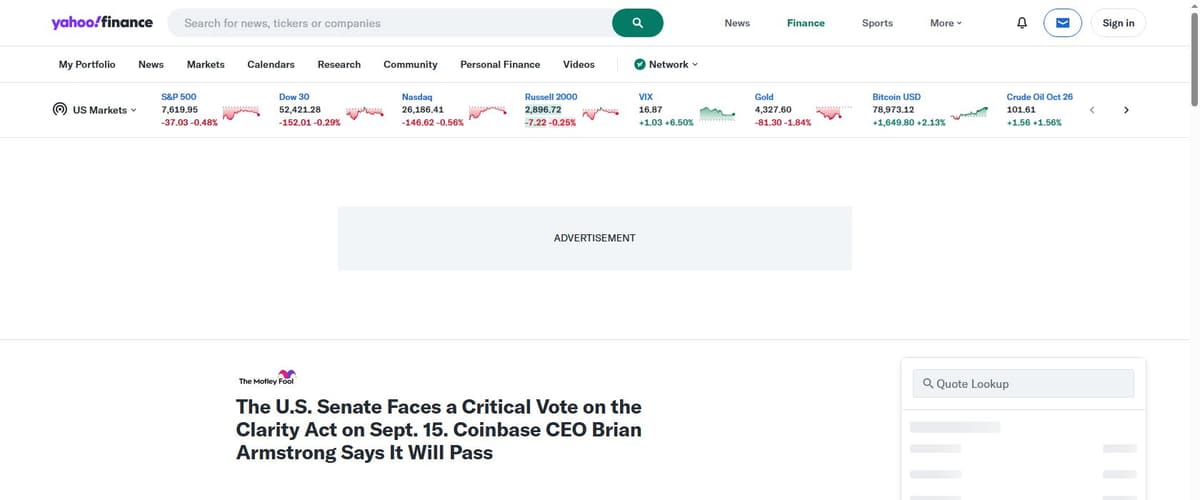
With that alternate route also down, the numbers get uglier. Roughly 90-95% of normal Hormuz traffic has been diverted since the war began, and real flow through the strait is now estimated at somewhere between 5 and 9 million barrels a day, against a pre-war average closer to 20 million. Oil broke above $100 a barrel this week for the first time since the conflict escalated, and crude was still up another 1.56% on Monday alone.
Wall Street Already Flinched
Stocks didn’t wait for the Fed to react. The S&P 500 opened Monday down 0.48%, the Nasdaq down 0.56%, and the Dow down 0.29%, based on live index data. Part of that is the oil shock; part of it is a fresh round of AI-sector leaders publicly calling for slower development, which hit growth stocks directly.
A falling stock market has historically dragged Bitcoin with it in the short term, which is one reason the coin-flip positioning above matters. A risk-off shock in equities doesn’t need a crypto-specific reason to knock Bitcoin off its current perch.
Four Days, Three Catalysts
The calendar this week is unusually loaded even by 2026 standards. The Senate holds a cloture vote on the CLARITY Act on Tuesday, September 15 at 2:15 p.m. ET, the procedural step that decides whether the bill advances to a full floor debate or dies for the year. Republicans hold 53 seats and need at least seven Democrats or independents to cross over.
A day later, the Fed’s rate decision lands Wednesday at 2:00 p.m. ET, and it is not a routine one. Markets have been pricing in a real chance of a rate hike to 3.75%-4.00% rather than a cut, after hawkish comments from the Fed chair at Jackson Hole and a solid August jobs report. A hike alongside an oil shock is a combination Bitcoin has never handled well.
The Bank of England follows on Thursday and the Bank of Japan on Friday, the same day quarterly U.S. options expire. None of these events exist in isolation this week. A hawkish Fed on top of $100 oil is a very different setup than a hawkish Fed on its own, and a CLARITY Act pass on top of both would complicate the picture further in the other direction.
For now, the chart, the leverage data, and the prediction markets all agree on one thing: nobody has actually decided where Bitcoin goes next. That’s rare going into a week with this much genuinely scheduled to happen.