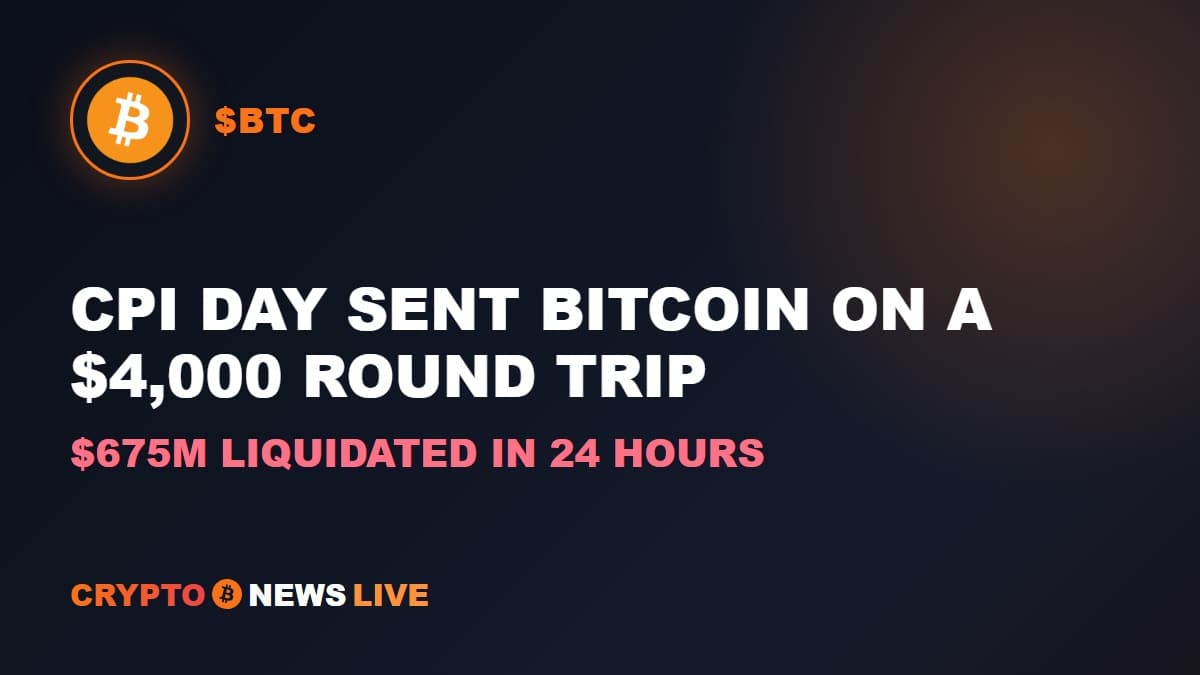
Bitcoin moved roughly $4,000 in less than six hours on Friday, and by Saturday morning it had gone almost nowhere. That’s the strange arithmetic of a CPI day: violent in the middle, flat at the edges.
The trigger was the U.S. Bureau of Labor Statistics’ August Consumer Price Index release at 8:30 a.m. Eastern on September 11. What followed was one of the sharper intraday reversals bitcoin has produced in weeks, and it left traders on both sides of the market nursing losses.
What the CPI Report Actually Said
Headline CPI rose 0.4% for the month and 3.4% year-over-year, unchanged from July’s annual pace, according to the BLS’s own release. Core CPI, which strips out food and energy, came in at 0.3% monthly and 2.4% annually, a slight cooling from July’s 2.5%.
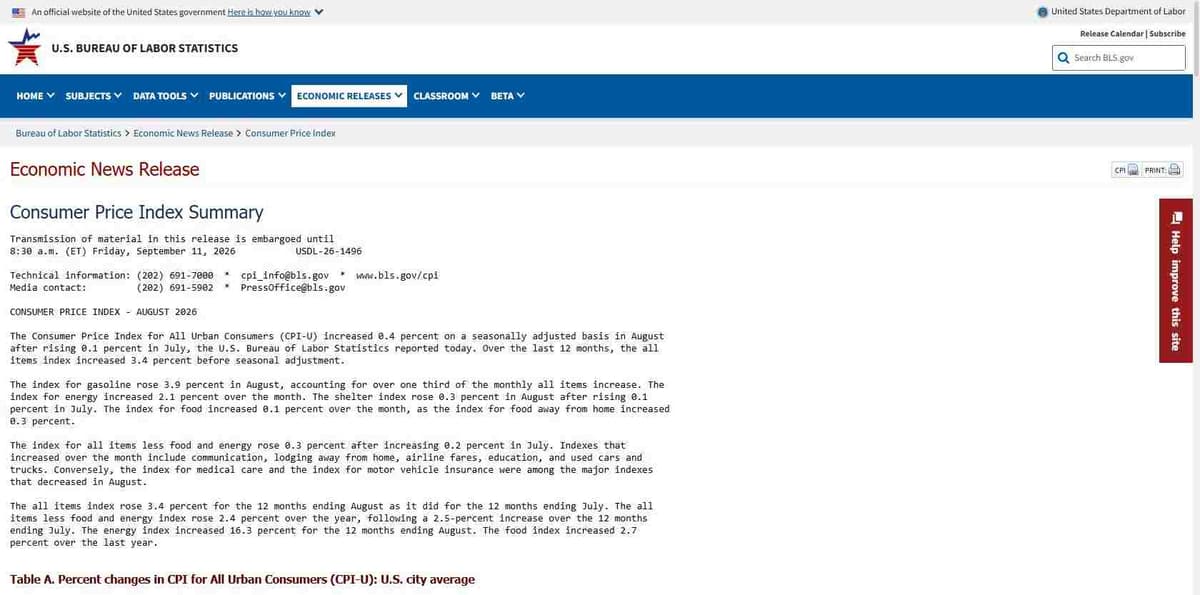
Energy was the real story inside the report. The energy index jumped 16.3% over the past year, with gasoline up 27.4% and fuel oil up a striking 52%. Food rose a comparatively mild 2.7%.
That energy spike matters for how this gets read. A handful of crypto commentators framed the 2.4% figure as headline inflation hitting a multi-year low. It isn’t. That number is core CPI, which excludes energy entirely, and headline inflation is still sitting at 3.4%, the same level it’s held for two straight months. Core did ease, but by a tenth of a point, not the dramatic drop the framing implied.
The Whipsaw, Priced In Minutes
Bitcoin’s reaction was immediate and messy. Within the first minute of the release, price jumped roughly $1,000. From there it kept climbing through the U.S. cash-equities open, adding close to 5% in under two hours and briefly tagging just under $80,000.
The move didn’t hold. Bitcoin gave back the entire spike and then some, dropping toward $76,000 by midday before settling into a tighter range. A five-day chart shows the full round trip: a sharp vertical push into the high-$70,000s to just shy of $81,000, followed by an equally sharp collapse back to the mid-$76,000s, all inside about 18 hours.
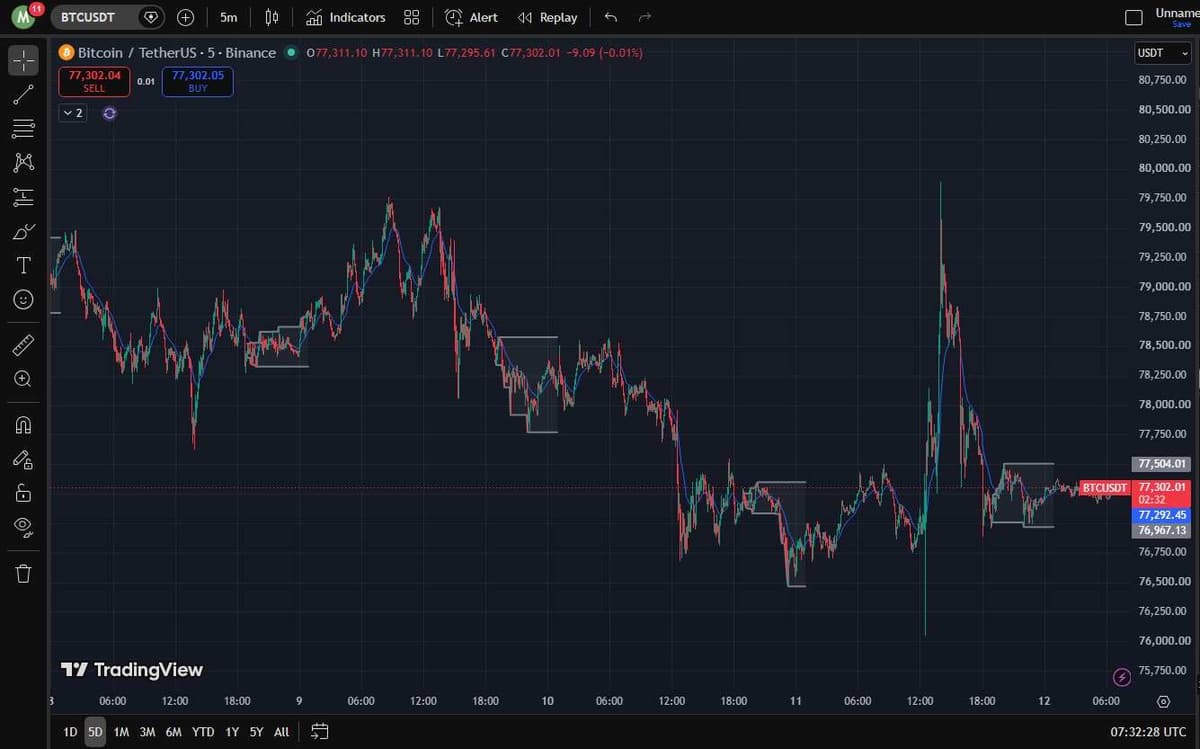
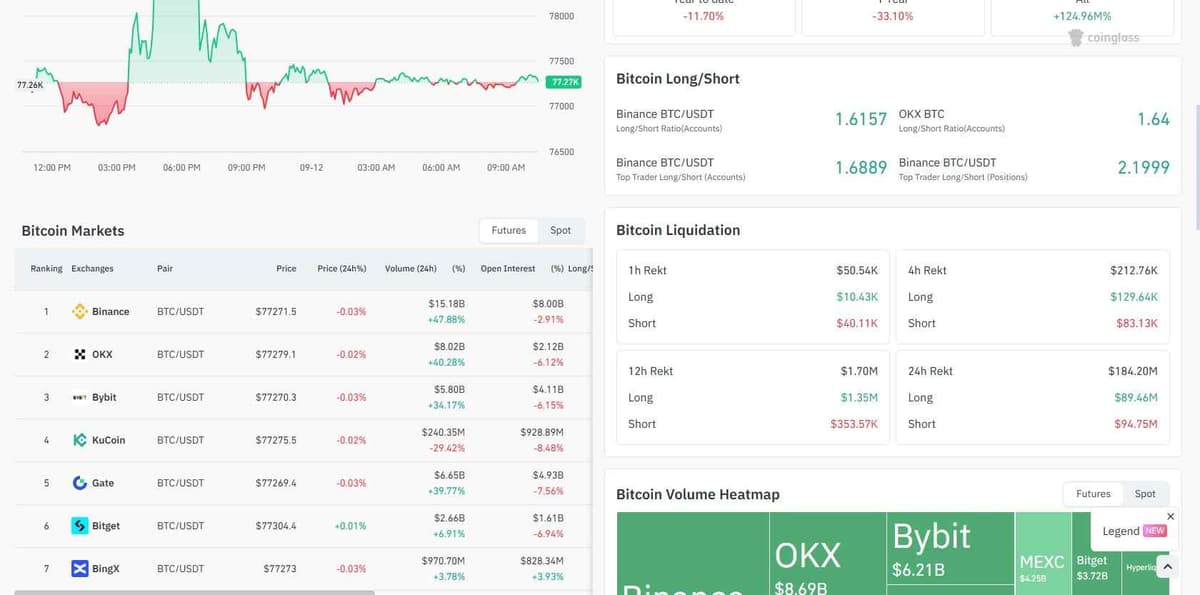
By Saturday morning, bitcoin had drifted back to around $77,300, essentially unchanged from where it started before the data dropped. The entire multi-thousand-dollar round trip netted out to almost nothing on a 24-hour chart, which is exactly the kind of price action that shakes out leveraged positions on both sides.
A Two-Way Liquidation Event
CoinGlass data put total 24-hour liquidations across the crypto derivatives market at $674.65 million, split almost evenly between $292.66 million in long liquidations and $381.99 million in short liquidations. Roughly 95,000 individual trader positions were wiped out.
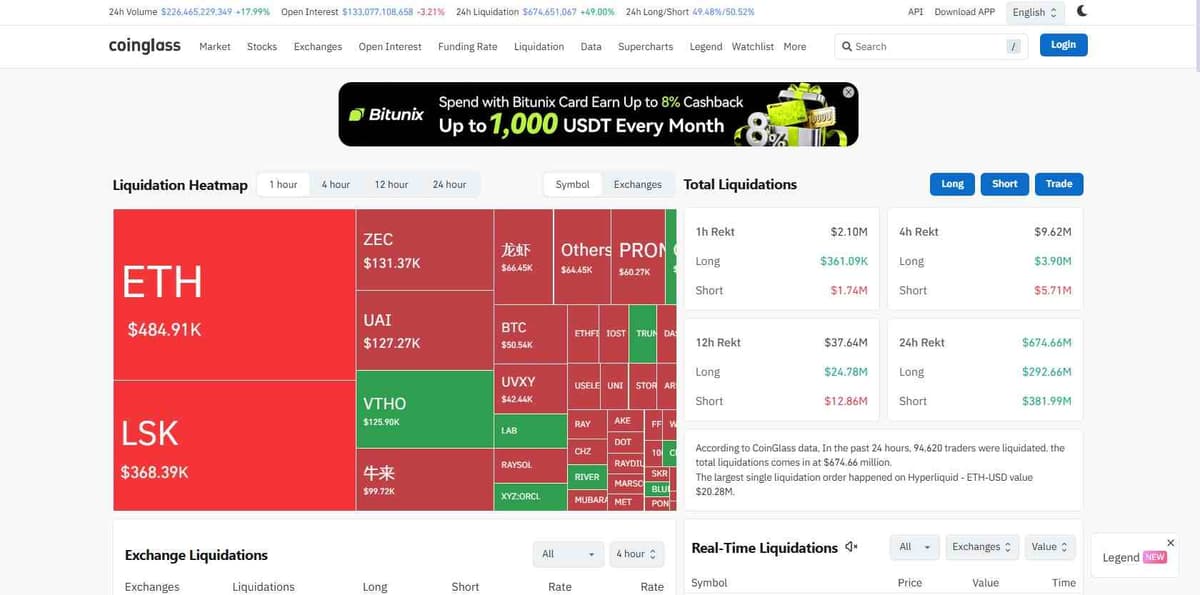
That split is the tell. A one-directional liquidation event usually means the market was leaning hard one way before the data hit. This wasn’t that. Traders who went long into the initial spike got squeezed on the reversal, and traders who’d shorted into resistance got squeezed on the way up first. Both bets were punished within the same session.
Positioning Was Flat Going In, and Stayed Flat
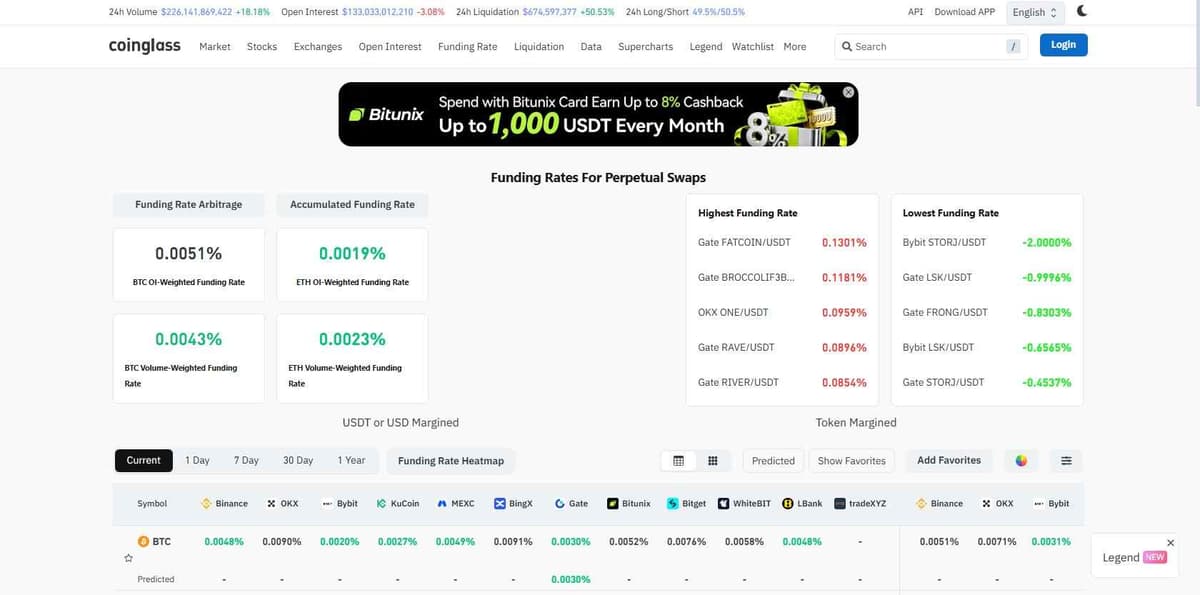
Funding rates across major exchanges tell a consistent story: there was no crowded skew to unwind. Binance, OKX, Bybit, and Gate were all printing funding rates in the 0.002% to 0.009% range at the time of writing, which is close to neutral and nowhere near the elevated levels that typically precede a one-sided liquidation cascade.
Open interest on Binance’s BTC/USDT pair sat around $8 billion following the move, down roughly 3% from before the release, consistent with a genuine deleveraging event rather than fresh directional bets piling in after the dust settled. Bitcoin’s total futures open interest across all venues stood near $51.6 billion, with the asset’s market cap at roughly $1.55 trillion.
What’s Left to Watch
The next scheduled catalyst is close. Per CME’s FedWatch tool, the Federal Reserve’s FOMC meets again on September 16, just days after this report, and a still-elevated headline CPI reading next to a cooling-but-not-collapsing core number leaves the rate debate genuinely unsettled going in.
Energy remains the wildcard in the data itself. A 16.3% annual jump in energy costs, gasoline included, is the kind of input that can keep headline inflation sticky even while core cools, and it’s not something the Fed can wave away as noise.
For bitcoin specifically, Friday’s move is a reminder that a report which reads as “in line with expectations” on paper can still produce a 6% intraday range and nine-figure liquidations in both directions. The price ended up almost exactly where it started. The traders caught on the wrong side of the swing in between did not.