Bitcoin barely blinked after the Federal Reserve’s preferred inflation gauge landed on Wednesday. That reaction is starting to look like a pattern rather than a coincidence.
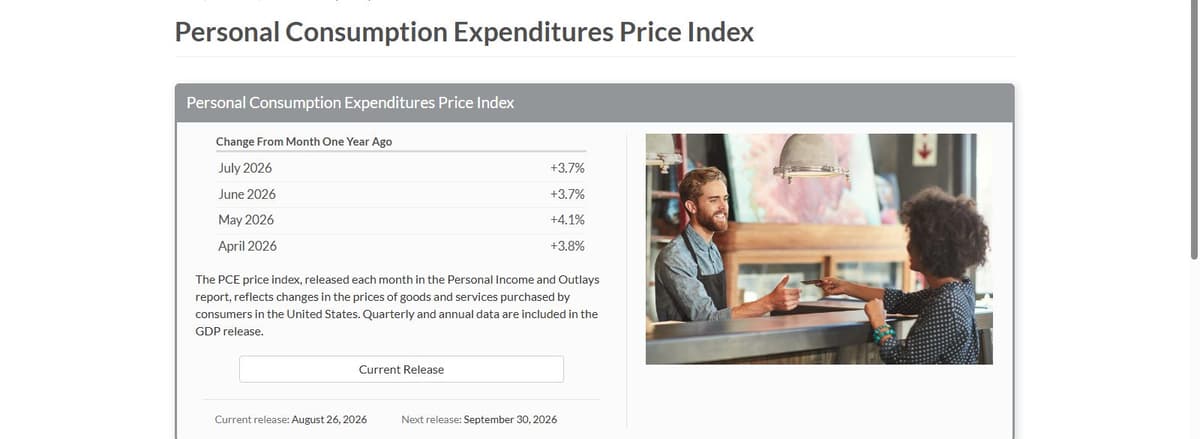
The Commerce Department’s July PCE report showed headline inflation up 0.2% for the month and 3.7% year over year. Core PCE, which strips out food and energy, came in at 0.2% monthly and 3.3% annually, exactly matching forecasts.
Personal income rose 0.4%, the fastest pace since before summer. But real consumer spending, adjusted for inflation, came in essentially flat, a sharp slowdown from June’s 0.4% gain.
Bitcoin traded near $79,300 through the release and the hours after. That kept it inside the same $79,000 to $81,000 band it had already been sitting in.
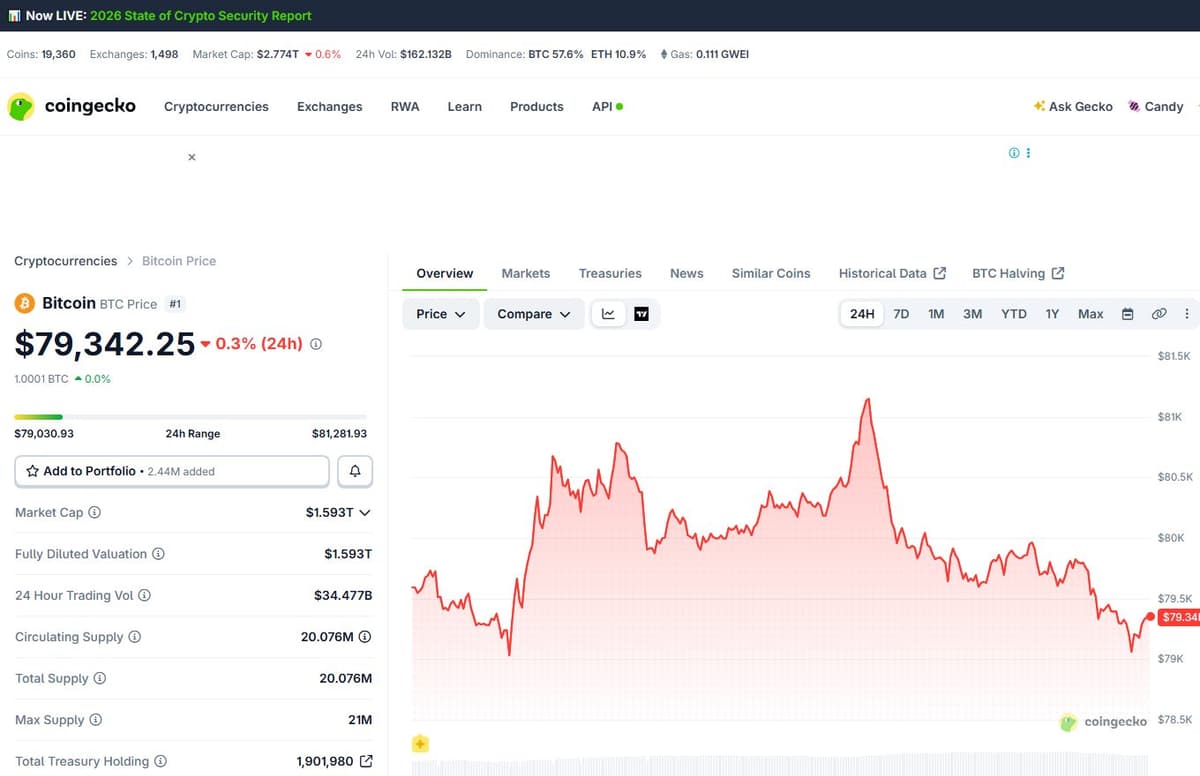
That non-reaction matters more than it looks. A report that was technically in line with estimates but showed spending stalling would normally give markets something to chew on. Bond yields did move on it.
Crypto mostly didn’t. Bitcoin ETFs kept buying straight through the data. August 27 alone brought $242.3 million in net inflows, the ninth straight trading day of inflows dating back to August 17.
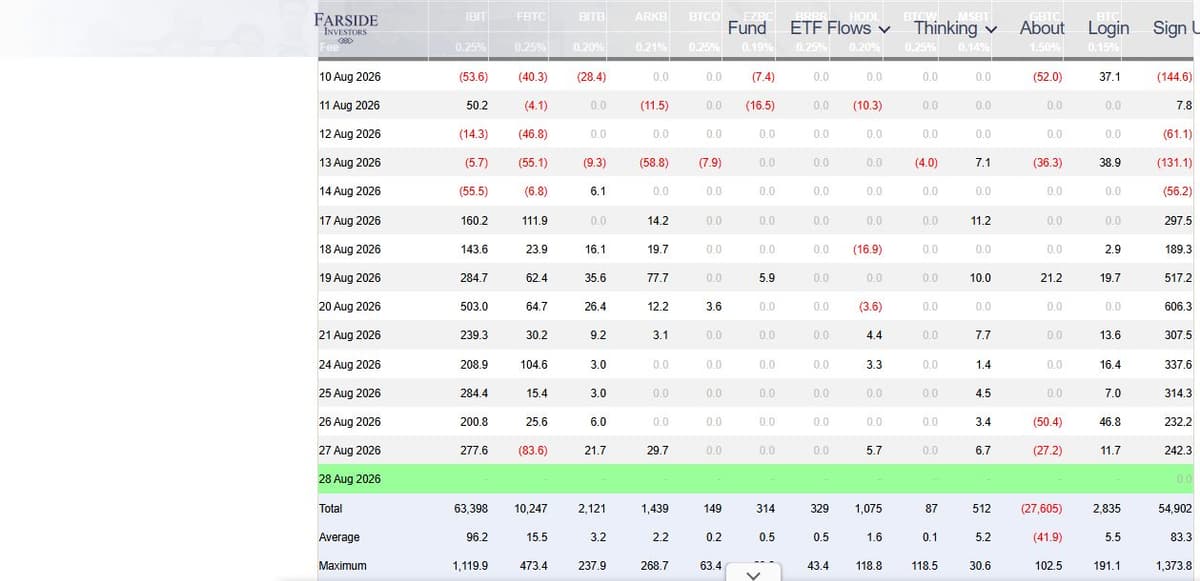
Demand that doesn’t pause for a mixed inflation print is a different animal than demand that’s chasing a headline.
Friday Is Actually the Event
Wednesday’s data was a preview. The real test lands Friday morning, 8am Mountain Time, 10am Eastern, at Jackson Hole.
Kevin Warsh delivers his first speech as Federal Reserve Chair there, a role he’s held for roughly three months. Investors want him to lay out conditions for a rate move. He has a track record of not doing that, UBS economists have noted his unwillingness to hand markets a road map.
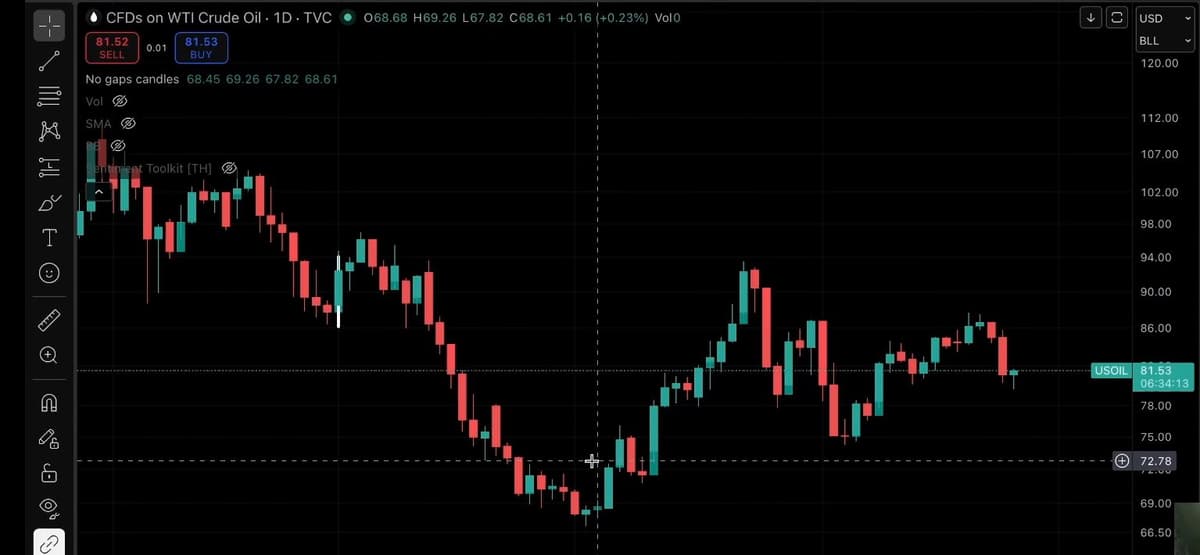
Inflation is still running above the Fed’s 2% target. Oil prices remain elevated against the backdrop of ongoing tension with Iran, and pressure is building for a rate hike at the September meeting rather than the cut markets spent most of the year expecting.
Warsh threading that needle, hawkish enough to look serious about the inflation data, calm enough not to spook a rally that’s still running, is the actual variable crypto traders are positioned around this week. Not Wednesday’s report.
The Level That Decides What Happens Next
On-chain analytics firm Glassnode has mapped out why $83,000 to $86,000 is the zone to watch regardless of what Warsh says.
A large concentration of long-term holders, 1.05 million BTC, sits at breakeven in that band. It’s the first heavy supply wall above spot. Below current price, a separate band near $62,000 to $65,000 holds 1.44 million BTC bought by recent buyers defending recent entries.
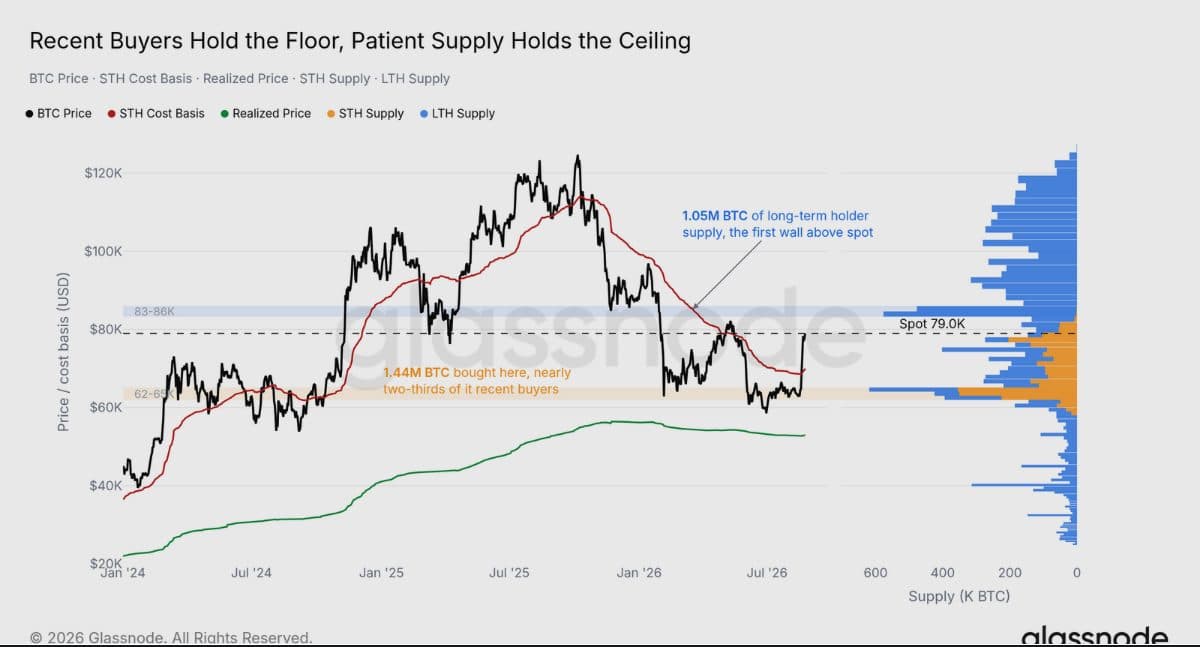
Settling above roughly $83,300 with ETF inflows still running would signal that wall is getting absorbed rather than defended. Failing there would leave the door open for holders who’ve sat through the drawdown to sell into the first real bounce back to their cost basis.
That’s the same logic behind any resistance level on a price chart. A zone gets less significant the more it gets tested and rejected, and more significant the one time it finally holds. The difference here is the level isn’t drawn from a trendline. It’s drawn from where actual coins are sitting.
Source: Glassnode Research, “Squeeze into Supply”
Nothing about Wednesday’s data forces the Fed’s hand. Nothing about Friday’s speech is likely to hand traders a clean answer either.
What the past week has shown is that crypto’s bid has stopped waiting for clarity to keep buying. That’s either the market pricing in more confidence than the macro picture deserves, or a sign that the macro picture matters less than it used to.
This article is for informational purposes only and does not constitute financial or investment advice. Cryptocurrency markets are volatile. Always do your own research before making investment decisions.