
The Bitcoin weekly close on Sunday, October 11 at 23:59 UTC will say more than any hourly candle this week. Bitcoin is at about $82,700 as of 17:40 UTC Friday, and the line it has to finish above sits at $82,210.
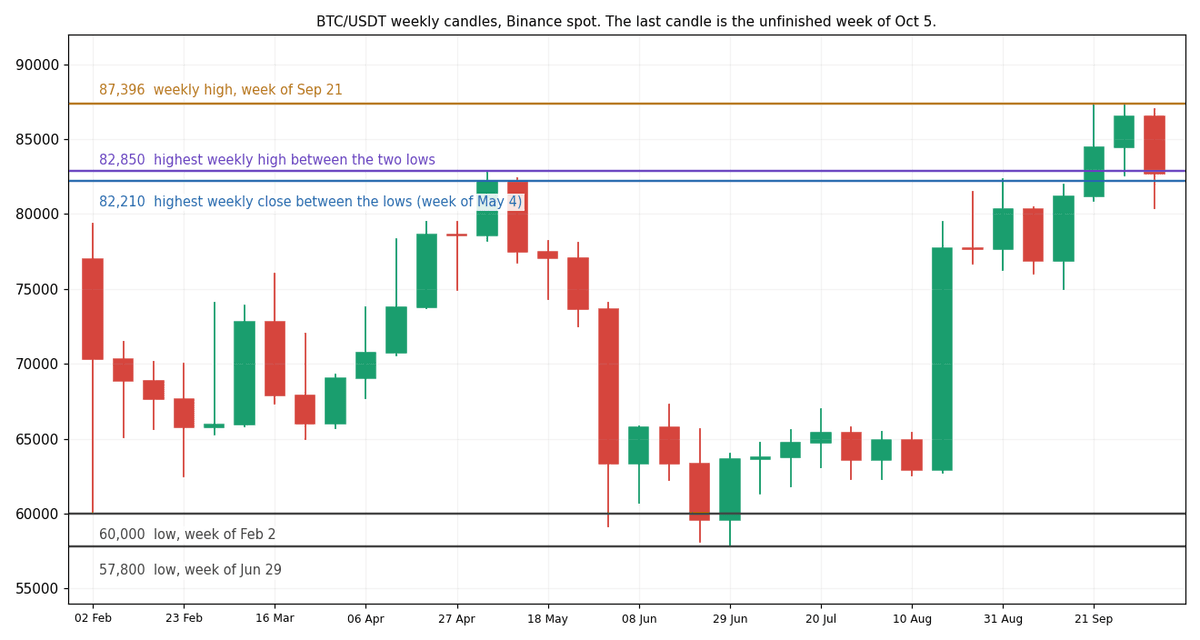
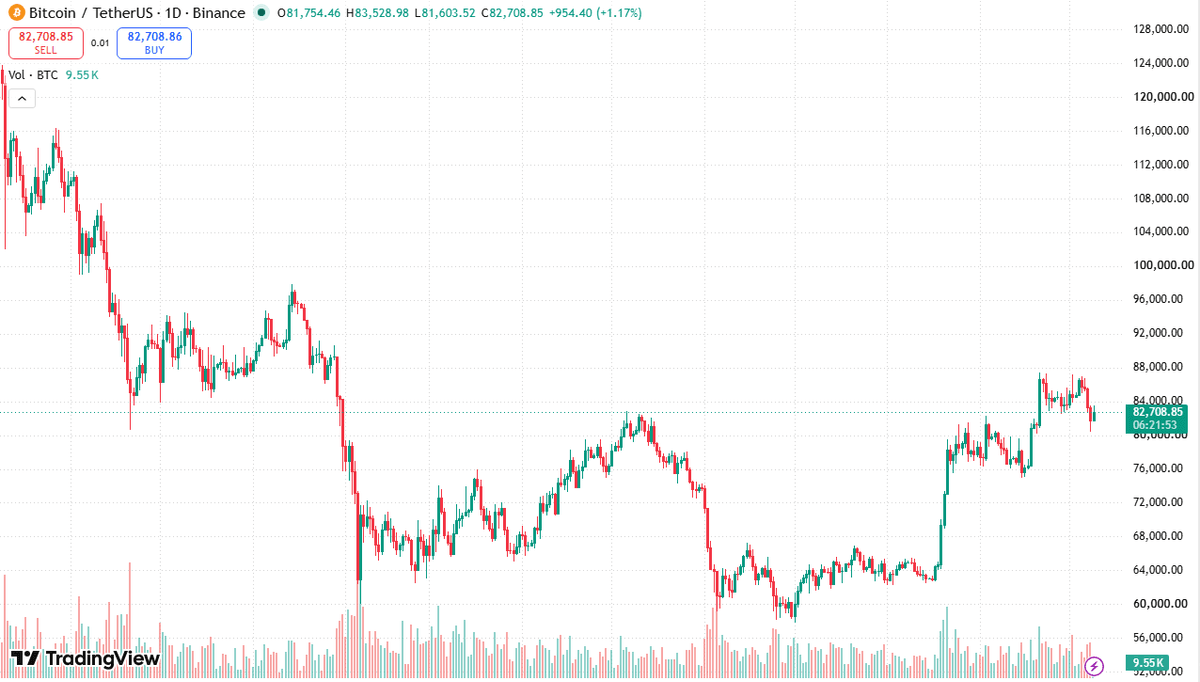
That number comes from the weekly chart. First low: $60,000, in the week of February 2. Second: $57,800, week of June 29, a little lower. Between the two, the best weekly close was $82,210.07 (week of May 4). The best weekly high, $82,850. Binance weekly candles are where both numbers come from.
The Weekly Chart Shows a Double Bottom Neckline
Two lows within 3.7% of each other,, with a ceiling between them, is the outline of a double bottom. Traders call the ceiling the neckline. Bitcoin already closed above it twice, at $84,472 for the week of September 21 and $86,530 for the week of September 28.
This week is the retest, and the weekly close decides whether it holds. The week opened Monday, October 5 at $86,530, ran into $86,999 and then fell. Thursday’s low on Binance spot was $80,393.56, which is 2.2% under the neckline and 7.1% under the weekly open.
ETF Outflows Ahead of the Bitcoin Weekly Close
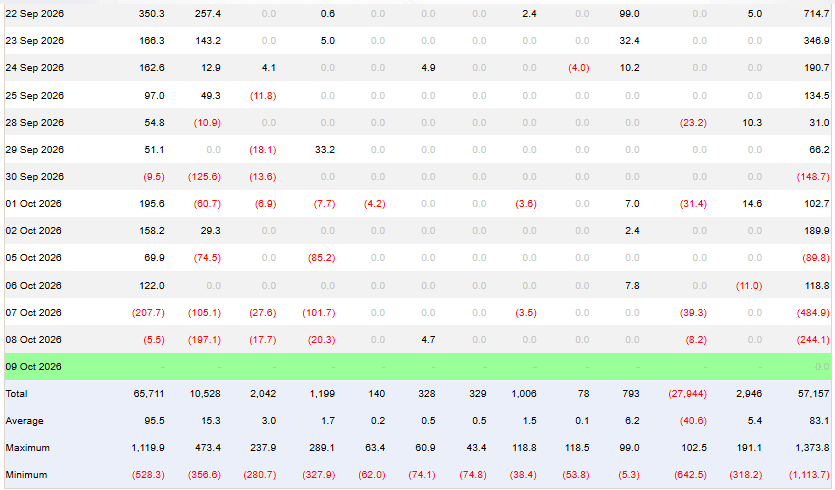
Farside Investors logged net outflows from U.S. spot Bitcoin ETFs of $484.9 million on Wednesday, October 7 and $244.1 million on Thursday, October 8. That is $729.0 million over two sessions. Across the four sessions of this week the net figure is negative $700.0 million, after $118.8 million of inflows on Tuesday.
FBTC led Thursday with $197.1 million out. IBIT, the largest fund, lost only $5.5 million that day. Friday’s row on Farside’s table is still empty, so this week’s flow total is not final before the weekly close.
Liquidations Hit Shorts on the Bounce
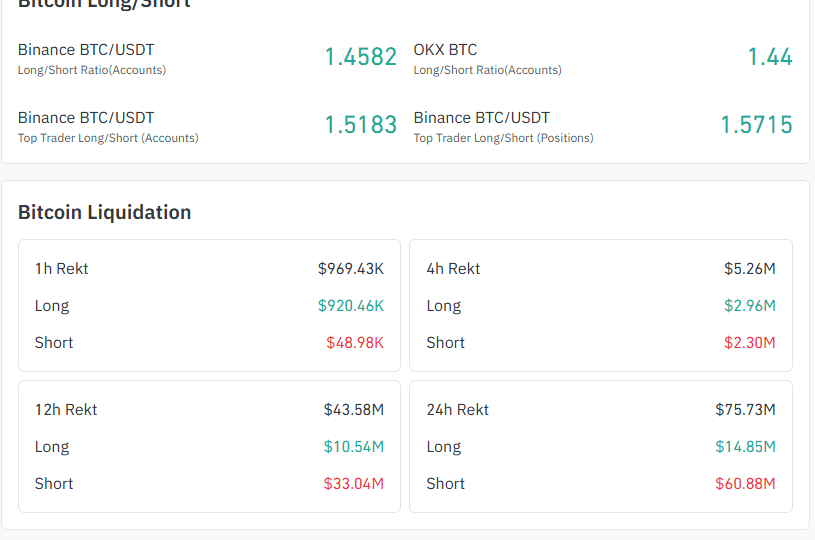
Coinglass showed $75.73 million of Bitcoin liquidations over 24 hours as of about 17:41 UTC Friday. Shorts accounted for $60.88 million of that, about 80%, and longs for $14.85 million.
Thursday made the low. Friday so far has gone from $81,754 up to $83,529. Further down that page the Binance BTC/USDT account long-short ratio read 1.4582. One snapshot, no signal in it.
Bitcoin Weekly Close: Two Scenarios
Regime check. Bitcoin trades above its 100-day average of roughly $72,480, yet sits inside its 20-day range.
Bull case first. A Bitcoin weekly close at or above $82,210.07 and the neckline reclaim stands. A daily close above $87,396, the top of the three failed highs from the week of September 21, October 2 and October 5, would be the first one above that zone. A daily close under $80,393.56, this week’s low, cancels it.
Bear case: a weekly close under $82,210.07 followed by a daily close under $80,393.56 opens $74,968, the low of September 15. A daily close back above $82,210.07 cancels it. The Wednesday flush we covered earlier this week and the derivatives-led RLC move both show how fast positioning shifts when levels break.
The evidence is balanced. The trend filter is positive, the two ETF outflow days are negative, and the weekly candle is not finished. The Bitcoin weekly close at 23:59 UTC on Sunday settles which scenario starts. Prices are Binance spot unless stated, and the live figures are as of Friday afternoon.