
The Bitcoin halving calendar is about to put one of crypto’s oldest rules back on the table: buy 500 days before a halving and sell 500 days after. The next Bitcoin halving lands at block 1,050,000, which the chain should reach around April 12, 2028. Count back 500 days and the buy window opens around November 29, 2026.
That is eight weeks away. CryptoNewsLive ran the rule against Bitstamp daily closes for the last three Bitcoin halving cycles and it made money every time, with a catch: each payoff was smaller than the one before.
The catch is the story.
What The Bitcoin Halving Rule Says And Where The Clock Stands
As of October 3 the chain tip sat near block 969,750, about 80,250 blocks short of block 1,050,000. At ten minutes a block that is roughly 557 days, which is where the April 2028 estimate comes from. Block times drift, so read the window’s start as late November, give or take a few weeks.
In April, Strategy’s Michael Saylor said the four-year cycle was finished, as we reported at the time. The next Bitcoin halving window is a direct test of whether price still keeps that calendar.
The halving dates themselves are not in dispute. Blocks 420,000, 630,000 and 840,000 carry the timestamps below.

Each one cut the mining reward in half. The next cut takes it to 1.5625 BTC.
Three Windows, Three Shrinking Payoffs
Buying 500 days before the 2016 Bitcoin halving and selling 500 days after turned $238 into $8,095, a 34.0x return. The 2020 window turned $3,885 into $44,904, or 11.6x. The 2024 window turned $16,836 into $111,238, or 6.6x.
| Halving | Buy (500 days before) | Sell (500 days after) | Multiple | Worst close vs entry | Exit vs peak close |
|---|---|---|---|---|---|
| Jul 9, 2016 | Feb 25, 2015 at $238 | Nov 21, 2017 at $8,095 | 34.0x | -11.9% | -1.6% |
| May 11, 2020 | Dec 28, 2018 at $3,885 | Sep 23, 2021 at $44,904 | 11.6x | -13.5% | -29.4% |
| Apr 20, 2024 | Dec 7, 2022 at $16,836 | Sep 2, 2025 at $111,238 | 6.6x | -2.3% | -9.8% |
No window ever closed more than 13.5% under its entry price. The worst was the 2020 cycle, at $3,359 on February 7, 2019, against a $3,885 entry.
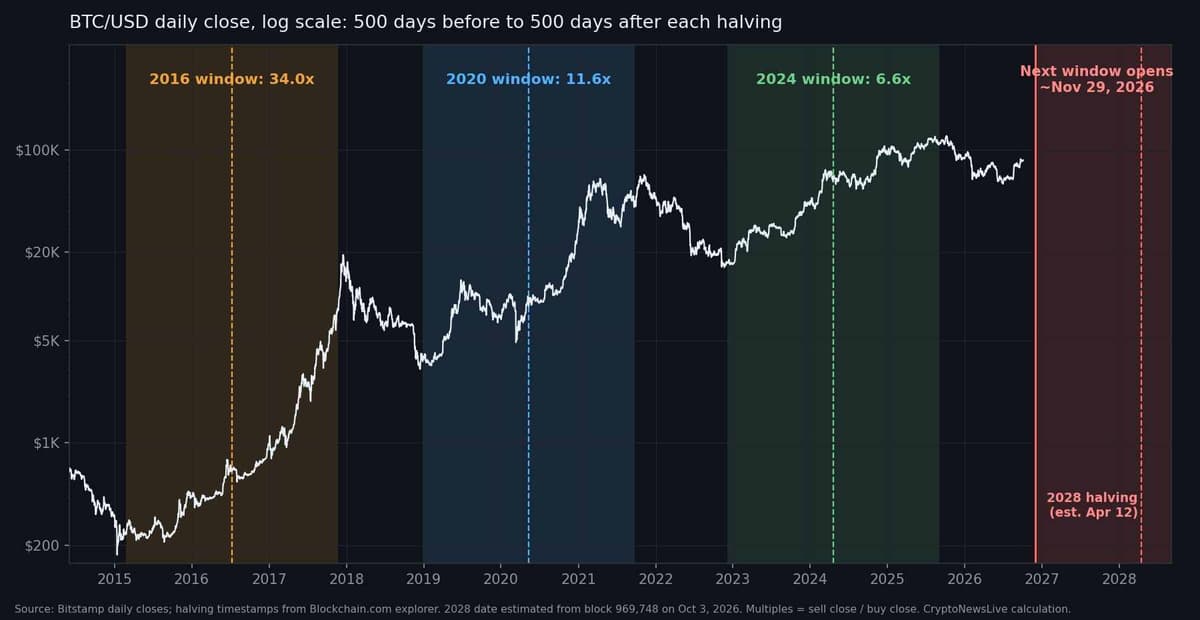
Three data points is a thin sample. It does not prove the next window pays 3x, or 30x, or anything at all.
It does show the multiple falling by about two-thirds, then by another 43%.
The Bitcoin Halving Rule Never Sold The Top
Selling 500 days after the Bitcoin halving missed the peak in the last two cycles. In 2021 the exit at $44,904 sat 29.4% under the window’s peak close of $63,564, set April 13, 2021. In 2025 the exit at $111,238 was 9.8% under the $123,360 close of August 13.
The 2016 exit was the exception, 1.6% under the peak close of $8,226 on November 20, 2017.
This Cycle’s Low Is Already 45% Behind
Here is where the rule gets awkward this time. The 2020 and 2024 windows opened 13 and 16 days after the cycle low, with entries only 22.2% and 6.8% above it. The 2016 window was looser, 42 days after the January 14, 2015 low and 38.8% above it.
This cycle did it the other way round. Bitcoin’s daily close bottomed at $58,526 on June 30, 2026, and the wick reached $57,735 on July 1. The window opens about 152 days after that close, and Bitcoin already trades 45.1% above it.
Our September 30 count of days since the October 2025 peak made the same point from the other side: the low was already 91 days old.
At today’s $84,931, an entry on November 29 would carry a bigger premium to the low than any of the last three windows did. A higher price by then only widens the gap.
The 200-Day Average Was Not A Better Entry
A common companion rule says to buy when Bitcoin trades under its 200-day moving average. The data does not back that up cleanly.
Across 4,095 daily observations from July 19, 2014 to October 3, 2025, the 1,592 days that closed under the 200-day average produced a median 365-day forward return of +46.5%. The 2,503 days above it produced +98.2%. The share of positive outcomes was close, 69% under against 72% above.
Overlapping windows and a handful of cycles flatter that result. It does say that sitting below the line was not an edge by itself.
Where Bitcoin Sits Today
Bitcoin traded at $84,931 on Bitstamp on October 3, 18.9% above its 200-day average of $71,428. It spent about 289 days under that line, from November 2, 2025 through August 18, then closed back above it on August 19 at $69,298.
The average itself is turning up: $71,428 now against $69,571 thirty days ago.
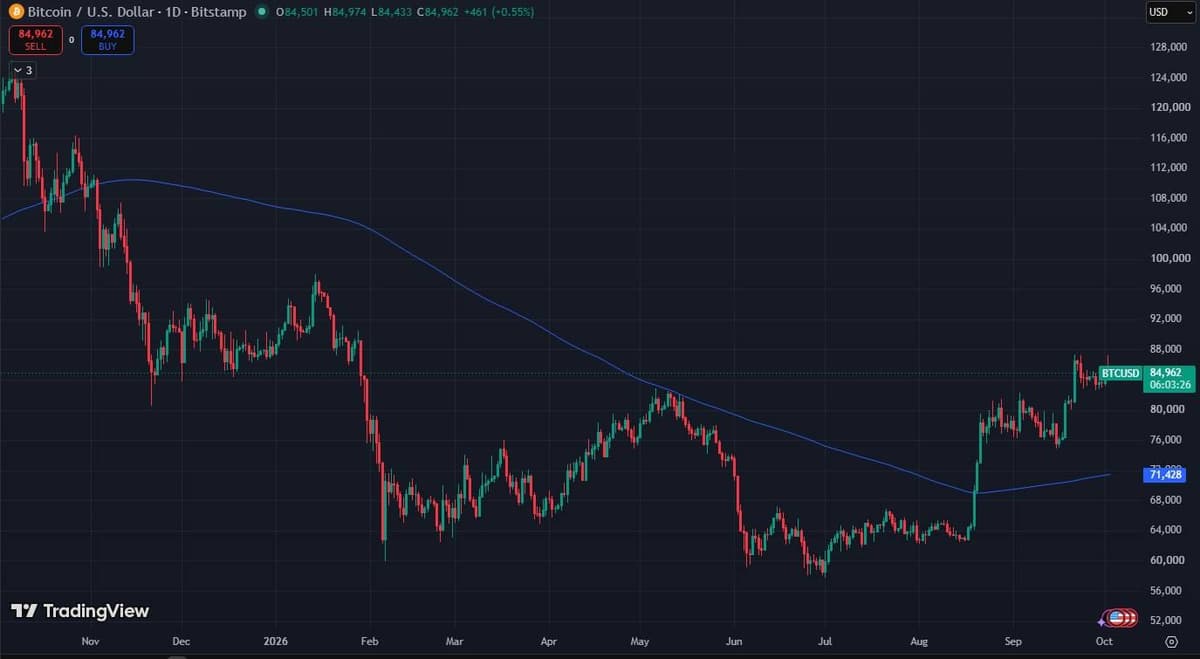
On the chart, $87,374 (the September 21 high) is the ceiling and $74,913 (the September low) the floor of the month’s range. The May 6 high of $82,833 now sits under price. Daily RSI(14) reads 64, computed from Bitstamp closes: firm, not stretched.
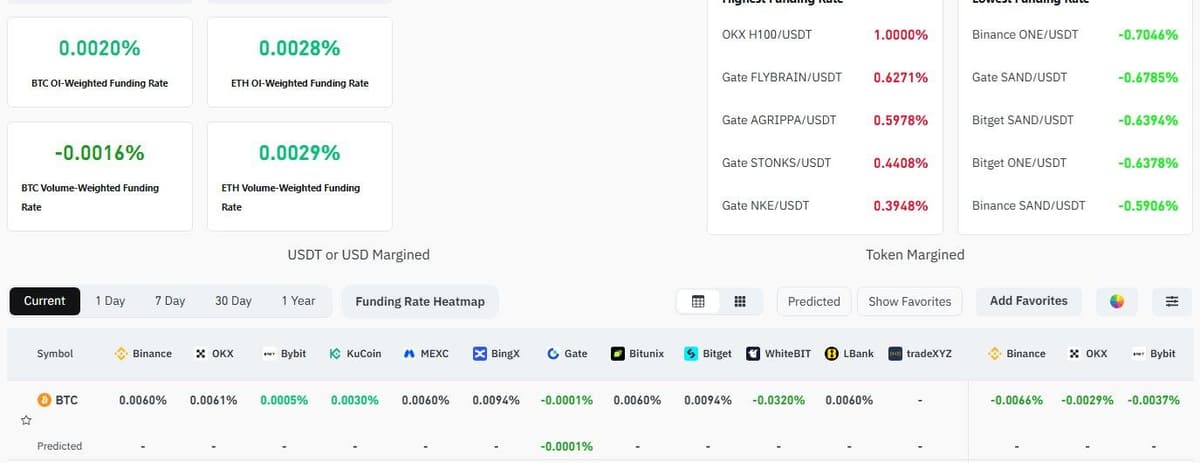
Positioning is not crowded. Coinglass shows the BTC open-interest-weighted funding rate at 0.0020% and the volume-weighted rate at -0.0016%, close to flat.
What Would Change The Read
The rule is a calendar, not a signal. A daily close above $87,374 would push Bitcoin to a new range high ahead of the window. A close under the $71,428 average would undo the August reclaim.
The window opens around November 29, and block 1,050,000, the 2028 Bitcoin halving, is the exit marker. Watch the block count, not the date on a calendar.
This is analysis of historical data, not financial advice, and three Bitcoin halving cycles are too few to build on.