
Bitcoin is 359 days past its all-time high. The last two bear markets bottomed 363 and 376 days after their peaks. This one already printed its low on day 268, and the price has since climbed 45%.
So which is it: a cycle that ended early, or one that still has a retest waiting inside a calendar window that has repeated twice? The data from the past two weeks leans one way, but not decisively.
The Calendar Says October, The Chart Says July
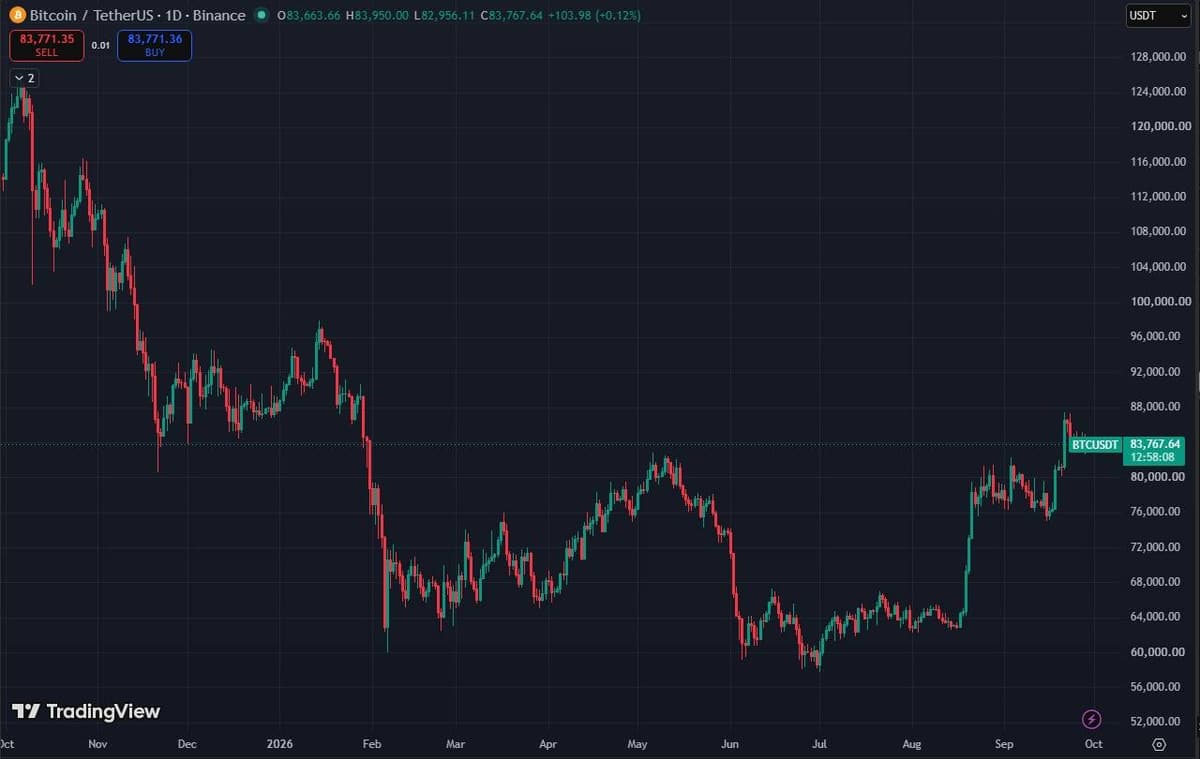
Bitcoin topped on October 6, 2025 at $126,199.63 on Binance’s daily candle. It bottomed on July 1, 2026 at $57,800.19, 268 days later, and closed the gap to about $83,900 today. That leaves the price 33% under its peak and 45% above its low.
The 2017 cycle ran 363 days from its December 17, 2017 peak of $19,798.68 to its December 15, 2018 low of $3,156.26. The 2021 cycle ran 376 days, from $69,000 on November 10, 2021 to $15,476 on November 21, 2022. Both figures come straight from Binance daily candles.
Apply those two durations to October 6 and you get a window from roughly October 4 to October 17, 2026. That is the stretch in which a cycle-timing bear would expect a final low. It is a sample of two, which is thin, and this cycle has already broken the pattern by bottoming about three months early.
What The Daily Chart Is Actually Showing
The September move was sharp and then went quiet. Bitcoin closed at $76,417 on September 17, jumped to $80,884 the next day, and spiked to $87,395.67 on September 21 before closing that day at $86,620, up 13% in four sessions.
Since then it has sat between $82,563 and $85,255 for a full week. The 14-day RSI reads about 62, down from a 30-day high near 74, so momentum has cooled without rolling over.
The levels are simple. Resistance is the $87.4K spike high. Support starts at the $80.1K to $80.9K lows from September 19 to 21, then the $75.0K to $76.0K zone from mid-September, where the 50-day average sits near $77.3K. The 200-day average is at roughly $71.3K, about 15% under the current price.
A daily close under $80,100 would put the post-breakout shelf in doubt and open the path toward the 50-day. A daily close above $87,400 would reopen the trend higher. Until one of those happens, the chart is a range, not a verdict.
Institutions Did Not Sell The Drop
Bitwise published its first institutional adoption report on September 23, based on interviews with senior investment staff at 15 large institutions, including endowments, pension funds, sovereign wealth funds and public companies. The headline finding is about behaviour during the drawdown this article is measuring.
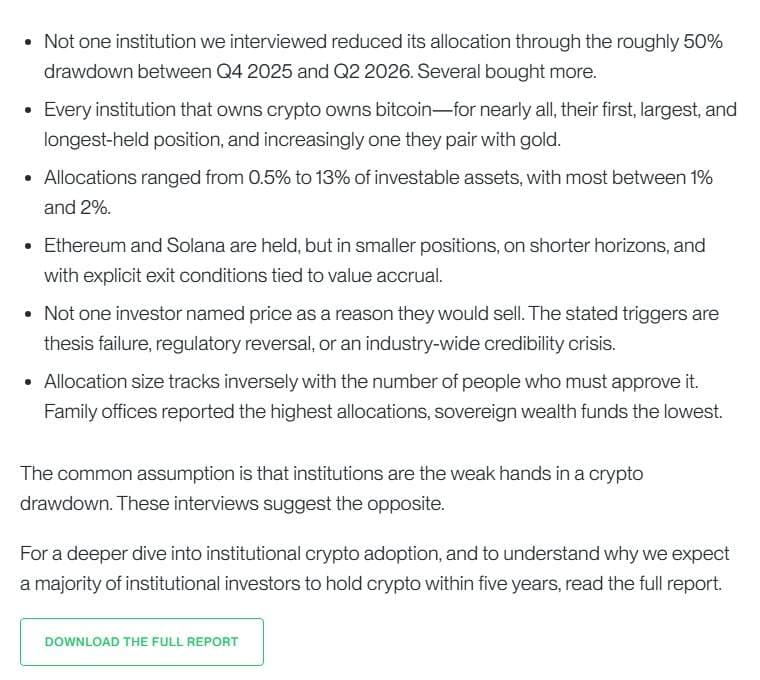
Bitwise says not one interviewed institution reduced its allocation through the roughly 50% drawdown between Q4 2025 and Q2 2026, and several bought more. Every institution that owns crypto owns bitcoin, and allocations ranged from 0.5% to 13% of investable assets, most between 1% and 2%.
It also reports that no investor named price as a reason to sell. The stated triggers were thesis failure, regulatory reversal or an industry-wide credibility crisis.
Two caveats matter. This is a survey of 15 firms, not a flow dataset, and it is published by a firm that sells crypto products. But it is a primary-source counterweight to the assumption that institutions were the weak hands at the bottom.
Coins Are Leaving Exchanges While Leverage Drains
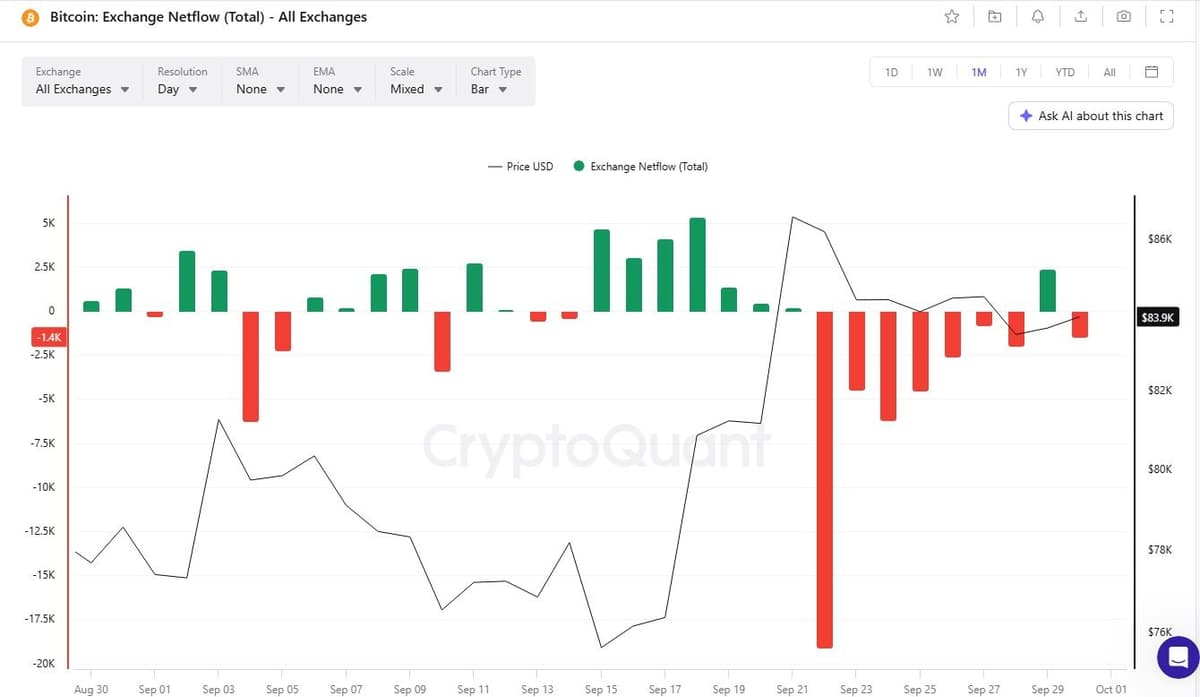
CryptoQuant’s all-exchange netflow shows bitcoin leaving trading venues for seven straight days, September 22 through 28. The first of those days was the largest, at roughly 19,000 BTC. There was a small net inflow on September 29, and the September 30 reading is back to an outflow of 1.4K BTC.
Derivatives tell a matching story of a market cooling off rather than loading up. Open interest on Binance’s BTCUSDT contract fell from $9.45 billion on September 22 to $7.73 billion on September 30, an 18% drop, while the price moved less than 3%.
Funding has flattened too. The last six eight-hour prints on the same contract averaged about 0.004%, under Binance’s 0.01% neutral baseline, and the latest was slightly negative at -0.0002%. The global account long/short ratio is 1.38, with 58% of accounts long, and top traders’ position ratio is about 1.9.
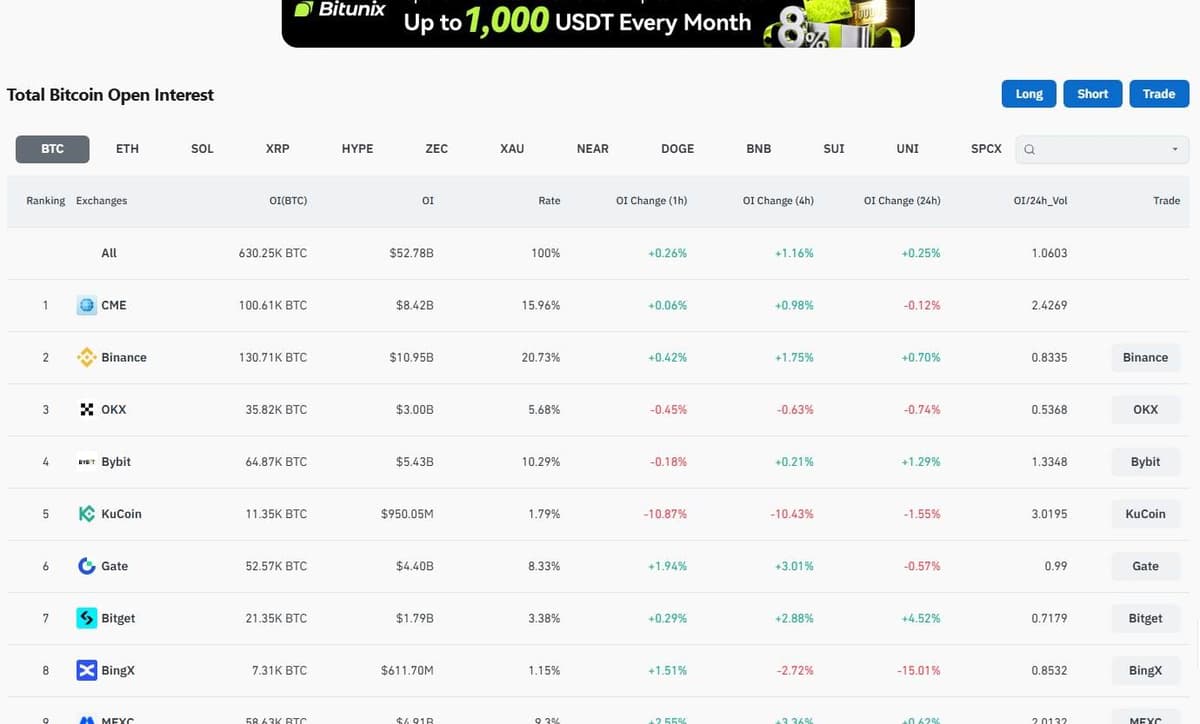
Fewer leveraged positions, flat funding and coins moving off exchanges is not a bullish signal on its own. It does mean the September spike was not built on a pile of fresh leverage that now has to unwind.
Two Readings Of Day 359
The early-low reading says July was the bottom, institutions held through it, and the quiet week is a base. The evidence for it is the 45% rebound, the flat funding and the exchange outflows.
The cycle-timing reading says the two prior bottoms landed 363 and 376 days after their peaks, and a retest of the $75K to $77K area inside the October 4 to 17 window would fit that rhythm without breaking the July low. That would not be a new bear leg, only a test of the shelf.
What would settle it is not the calendar. It is whether $80,100 holds on a daily close, and whether a push toward $87,400 arrives with open interest rising again or without it.