XRP traded near $1.50 on Wednesday and XLM near $0.22, and both sit under resistance they have already failed at. On CoinGlass’s aggregated liquidation maps, both also have more leveraged long positions stacked below the price than short positions above it.
A map like that is not a forecast. It does tell you which side has more to lose if the market moves first.
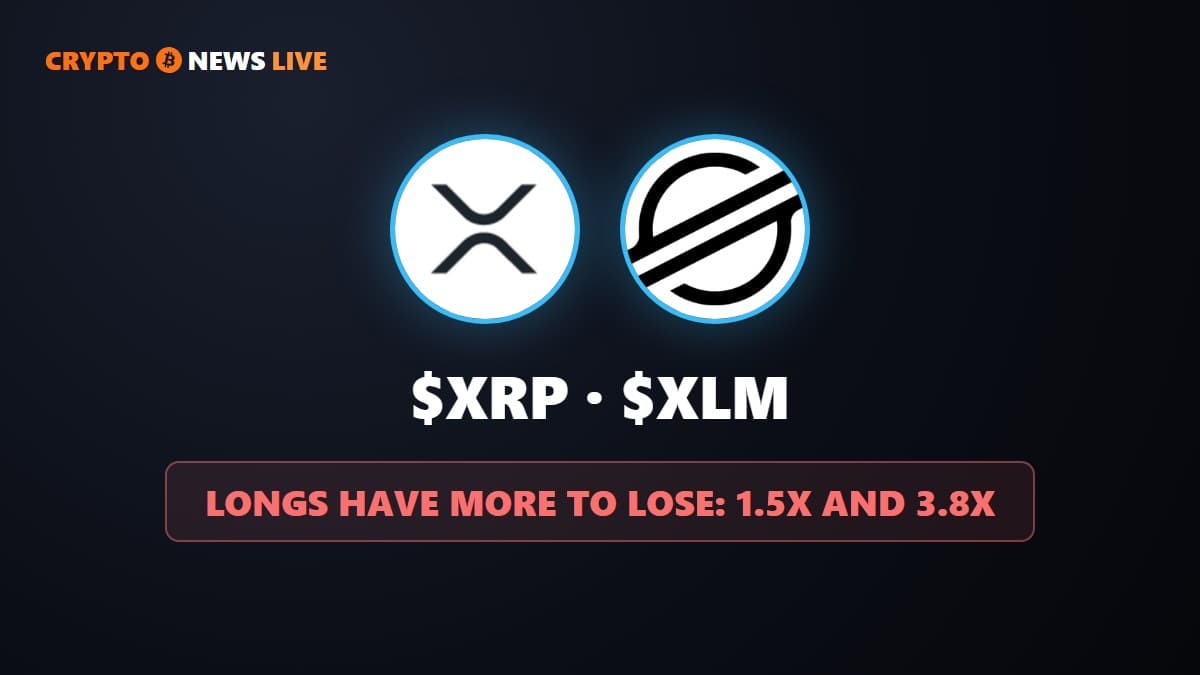
XRP’s Map Is 1.5x Heavier Below
CoinGlass’s one-year XRP exchange liquidation map, which adds up estimated liquidation levels across Binance, OKX and Bybit, shows $900.66 million of cumulative long liquidation leverage by the time price falls to $1.088. That is about 27% under the $1.495 reading on the chart.
The mirror image on the upside is $594.60 million of cumulative short liquidation leverage at $1.879, about 26% above. That is a ratio of 1.5 to 1, on a nearly symmetric price range.
The 180-day window is lopsided too. There, $515.79 million of longs sit down to $1.225, against $242.74 million of shorts up to $1.856, roughly 2.1 to 1.
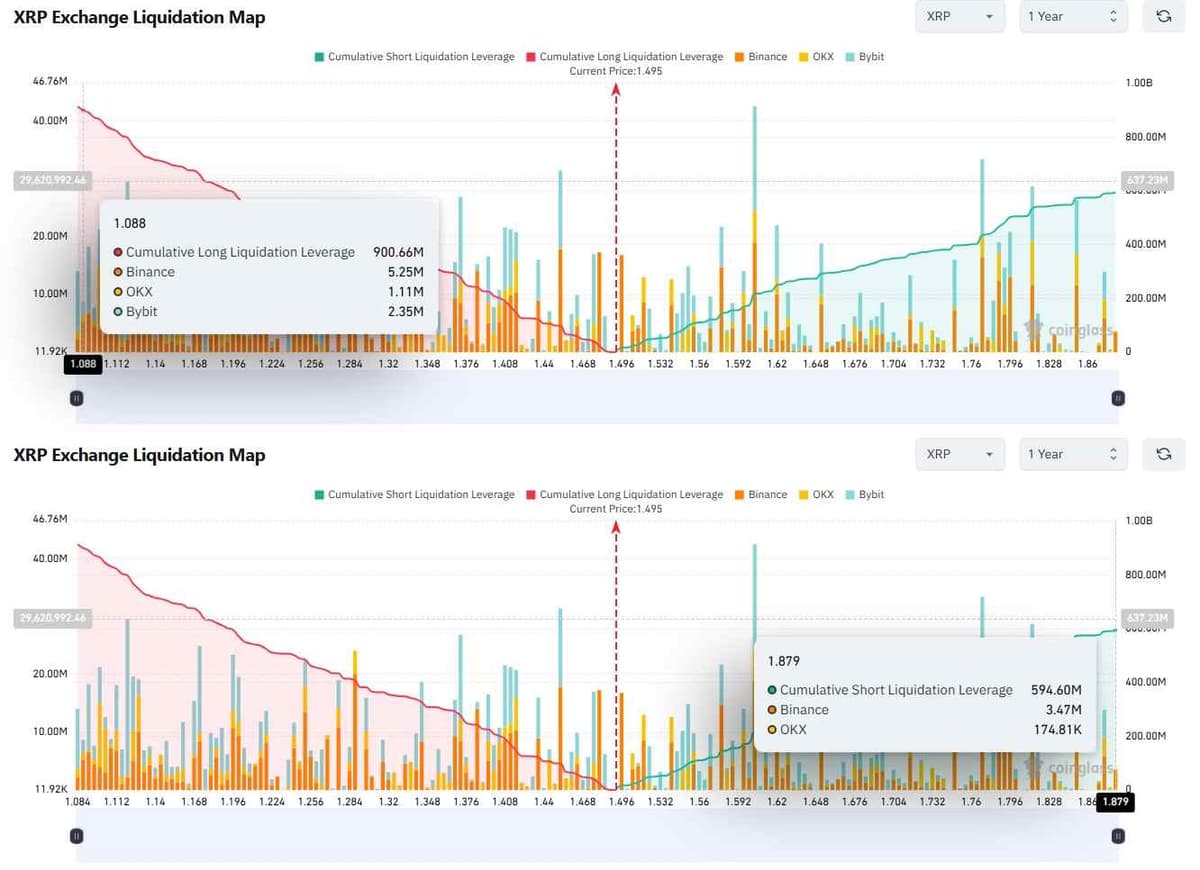
These maps are models of where leveraged positions would be force-closed, built from exchange data. They are not live order books, and they cover three venues, not the whole market.
XLM’s Lean Is Sharper, But Only In Recent Positions
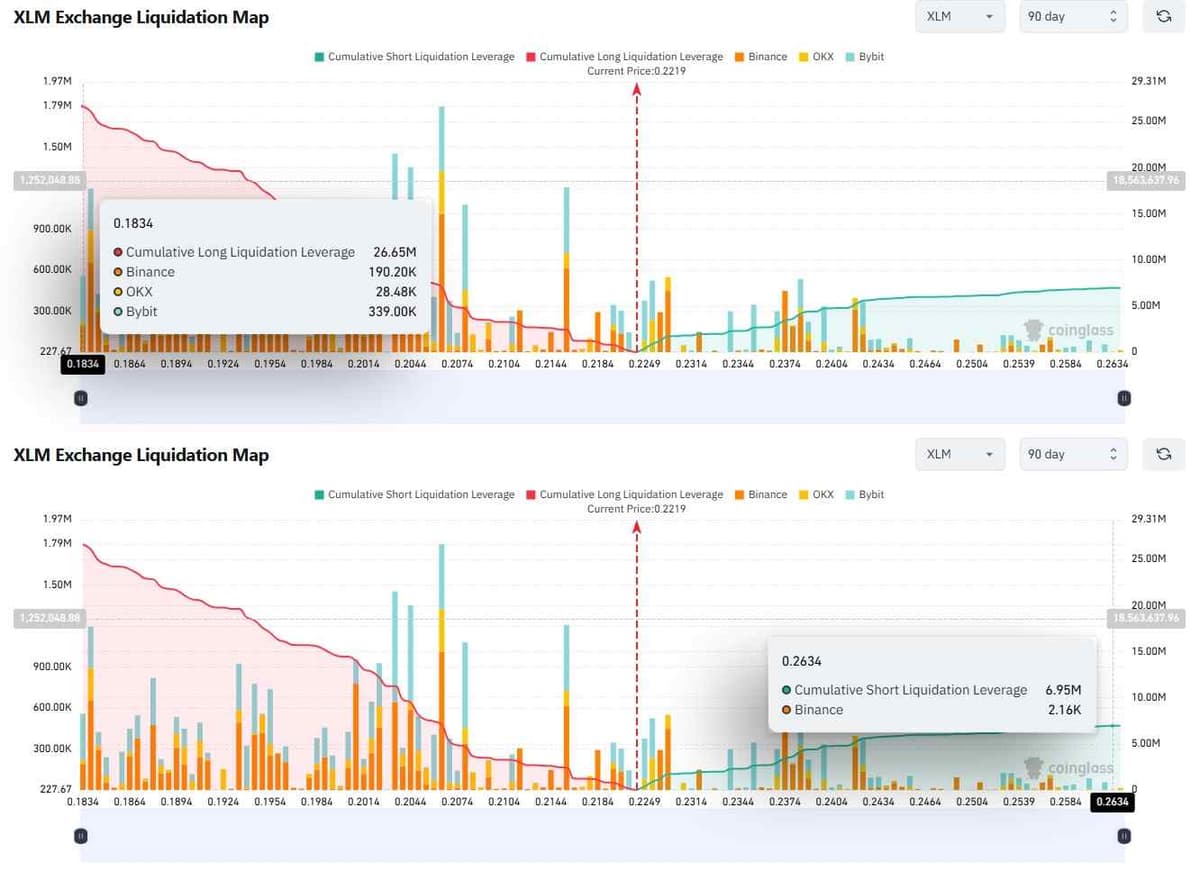
On the 90-day XLM map, $26.65 million of cumulative long liquidation leverage sits down at $0.1834, about 17% below the $0.2219 price on the chart. Only $6.95 million of shorts sit at $0.2634, about 19% above. That is 3.8 to 1.
Widen the window and most of that skew disappears. At 180 days it is $32.19 million of longs to $25.17 million of shorts, about 1.3 to 1. The lean in XLM comes from positions opened in the last three months, not from a structural imbalance.
Crowded Longs Add To It
Binance’s own account data says the same thing from the other side. About 72% of accounts trading the XRPUSDT perpetual are long, a long/short ratio of 2.56. On XLMUSDT it is about 65% long, a ratio of 1.84.
Funding is not stretched. The last six eight-hour funding prints averaged about 0.003% on XRP and 0.008% on XLM, both under Binance’s 0.01% neutral baseline. The leverage has been trimmed in one of them, though. XRPUSDT open interest on Binance slid from $560 million on September 23 to $465 million on September 30, a 17% drop, while XLM’s is flat at roughly $58 million.
Both Are Stuck Under Resistance
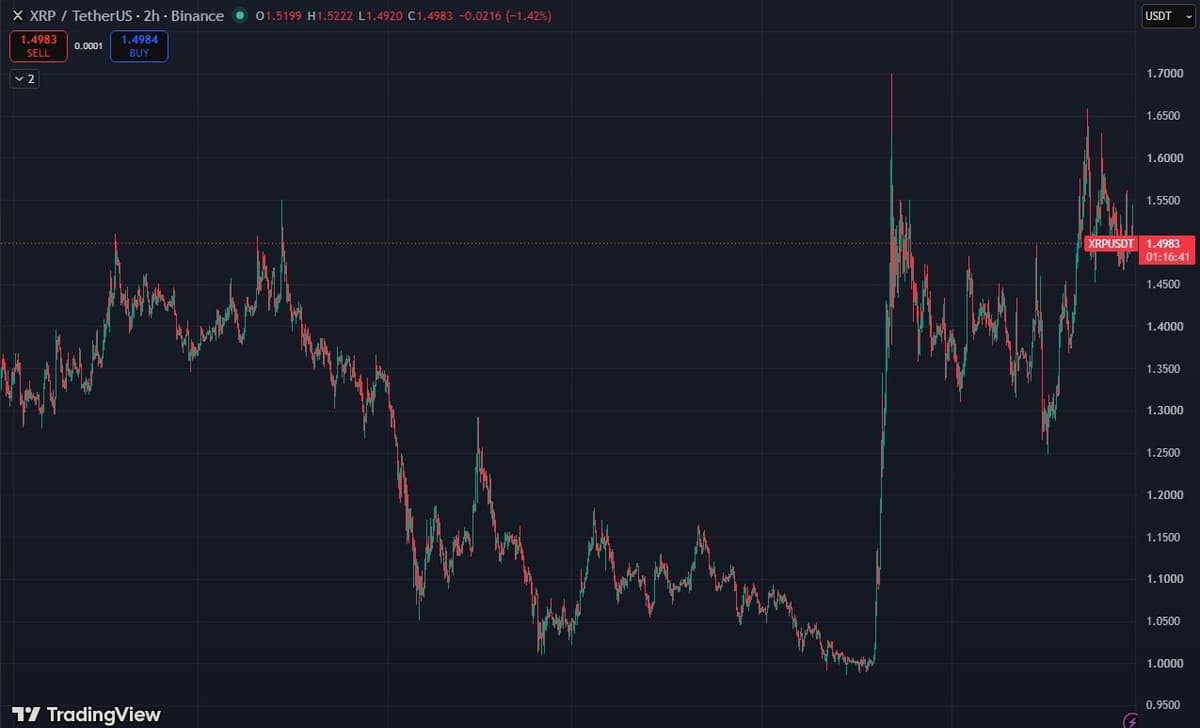
XRP has traded between about $1.47 and $1.66 since its September 21 breakout. The 30-day high is $1.6581 on September 23, and the 90-day high is $1.6999 from August 22. It has closed inside that band on nine straight days, September 21 to 29.
The 14-day RSI reads 56.6, neutral. XRP is above its 20-day average at $1.44, its 50-day at $1.36 and its 200-day at $1.28, so the trend is up and the structure is intact. A daily close under $1.44 would put the 20-day in play, and a close above $1.66 would reopen $1.70.
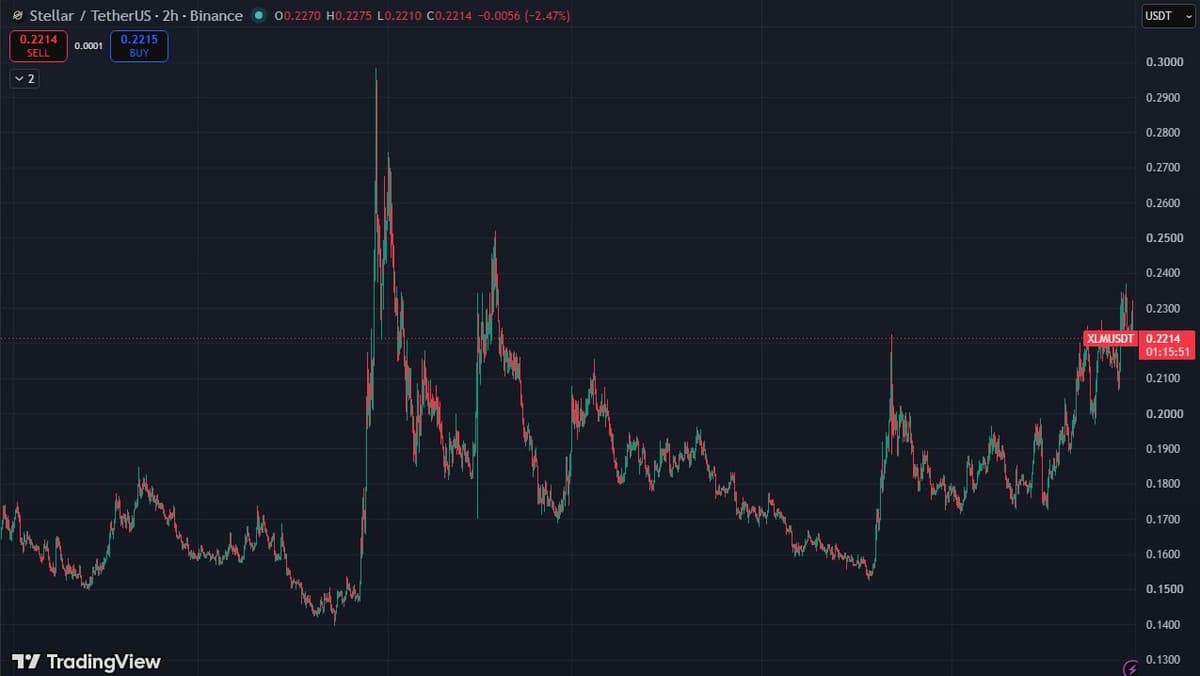
XLM is further extended. It is up about 25% in 30 days and 10% in a week, and on September 29 it touched $0.2371, its highest in 90 days. It then faded to close around $0.222.
RSI is 61, warm but not overbought. Support is the $0.2065 low from September 28, then the 20-day average near $0.202. The chart shows the real ceiling is overhead: a $0.25 high from June and a spike to roughly $0.30 in late May. Over the last 30 days its correlation to Bitcoin is 0.66, against 0.89 for XRP.
Two Dated Events The Maps Do Not Show
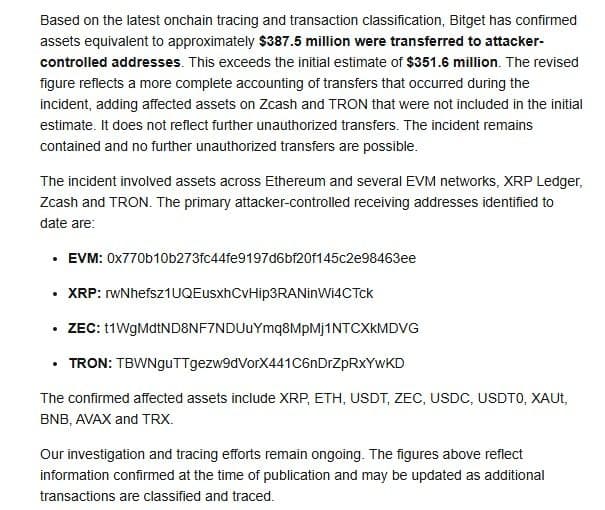
The first is the Bitget hack. On September 24, Bitget says, about $387.5 million was moved to attacker-controlled addresses, and its notice names an XRP Ledger address among them.
The XRP Ledger itself confirms the scale. That address received 102,976,680 XRP in three payments between 19:01 and 21:19 UTC on September 24, then sent 102,976,677 XRP onward in five payments between 21:42 and 23:43 UTC. Four were exactly 20 million XRP and the last was 22.98 million. At today’s price that is roughly $154 million.
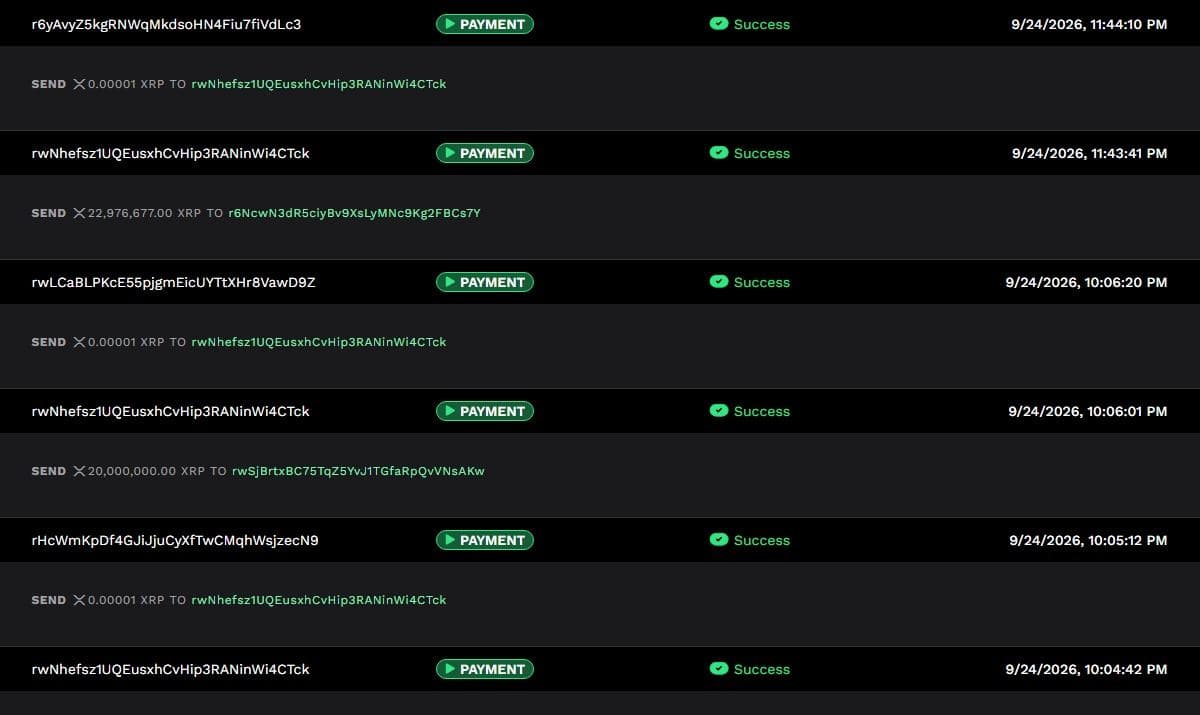
The five receiving wallets did not hold the coins either. Each was drained to under 25 XRP by September 27, with the coins broken into transfers mostly between about 30,000 and 520,000 XRP and forwarded to other addresses. The ledger shows where the coins moved, not whether they were sold, so the market impact is unproven. It is an overhang worth knowing about, not a confirmed seller.
The second is scheduled. Armada Acquisition Corp. II shareholders vote at 12:00 p.m. ET on September 30 on a merger with Evernorth, an XRP treasury company. If it passes, the combined company is expected to list on Nasdaq as XRPN.
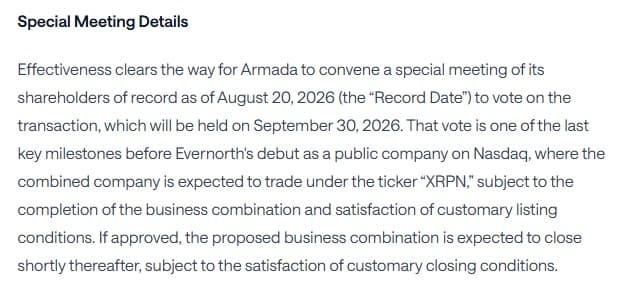
The vote result was not known when this was written. Either outcome is a headline that lands on an XRP market that is already sitting under its range ceiling.
What Would Settle It
A liquidation map can be right for weeks and still not pay off. A market can climb, leave downside liquidations unhit, and squeeze the shorts above it instead.
For XRP, the lines are $1.66 on the upside and $1.44 on the downside. For XLM, they are $0.2371 and $0.2065. A close through either side of those ranges would say which side of the map the market intends to visit first.