XRP is trading at $1.4977, up more than 7% on the day and sitting one cent below the psychological $1.50 level. XLM is at $0.2083, up over 5.5% and pushing into territory it hasn’t traded at in weeks. Both moves are landing at real, chart-visible resistance, not open air.
XRP Is Back at a Level That Has Rejected It Three Times
The daily chart shows XRP topping out in the $1.53-$1.55 zone on at least three separate occasions since late August, each time turning lower. The token then fell hard into the $1.25-$1.30 range around September 15, the day the Senate blocked the CLARITY Act’s cloture vote, before clawing back most of that loss over the past week.
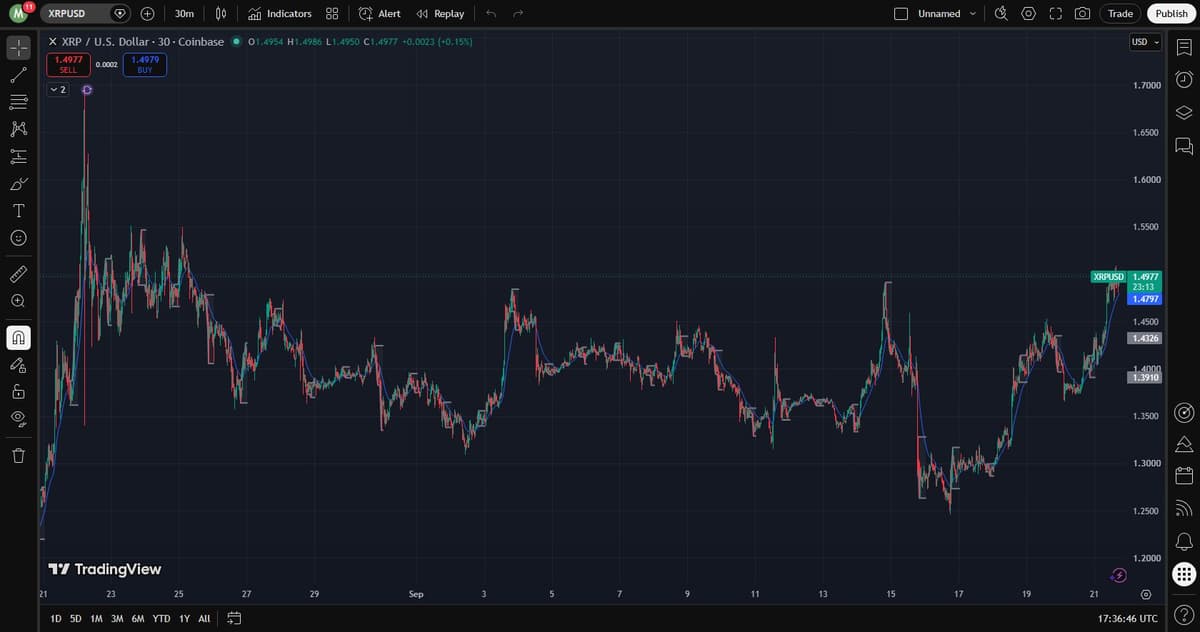
Today’s candle put XRP back at the door of that same zone. A clean break above $1.50 and through the $1.53-$1.55 ceiling would put XRP in open air for the first time in roughly a month, since the last time this exact zone got tested and failed. A rejection here, on the other hand, would put XRP back in the same range that’s capped it three times already this cycle.
XLM Already Broke Out, and Is Pushing Into New Multi-Week Territory
Stellar’s XLM tells a slightly different version of the same story. It spent most of September chopping in a $0.175-$0.20 band, fell to $0.175 on the same September 15 sell-off, and has since not just recovered but broken clean above that range to an intraday high near $0.2103, its best level in weeks.
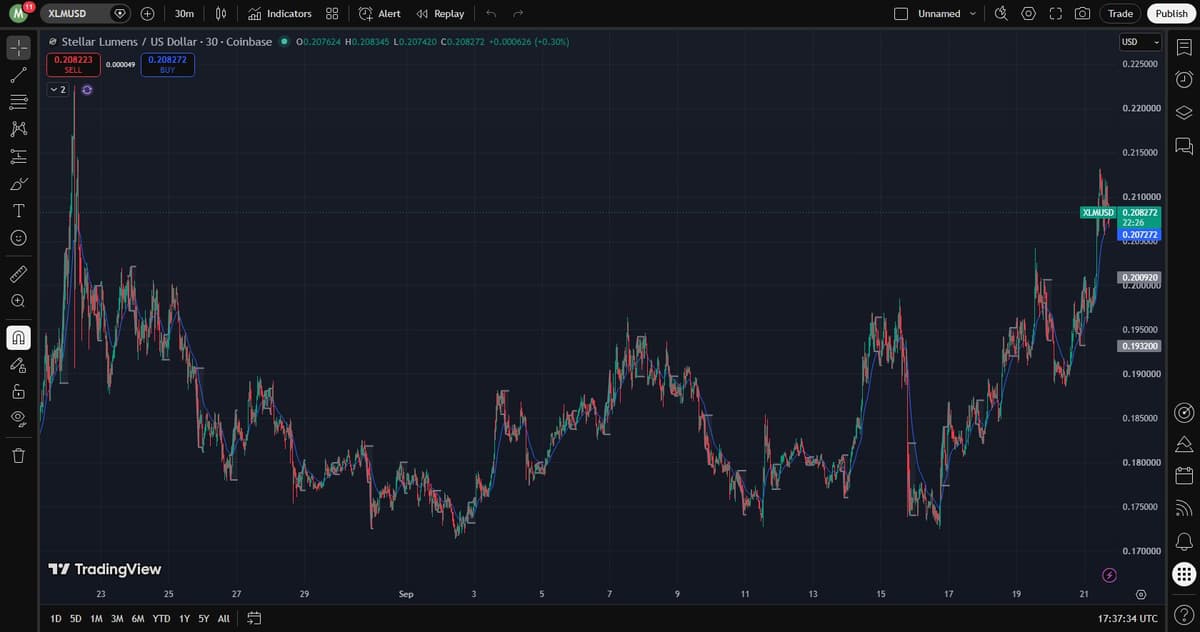
Unlike XRP, which is still knocking on its ceiling, XLM has already cleared its recent range. The question for XLM now isn’t whether it breaks out, it’s whether it holds above the old range, roughly $0.195-$0.20, on any pullback. Holding that zone as support would confirm the breakout; losing it again would put the move back in question.
Neither Move Is Happening in Isolation
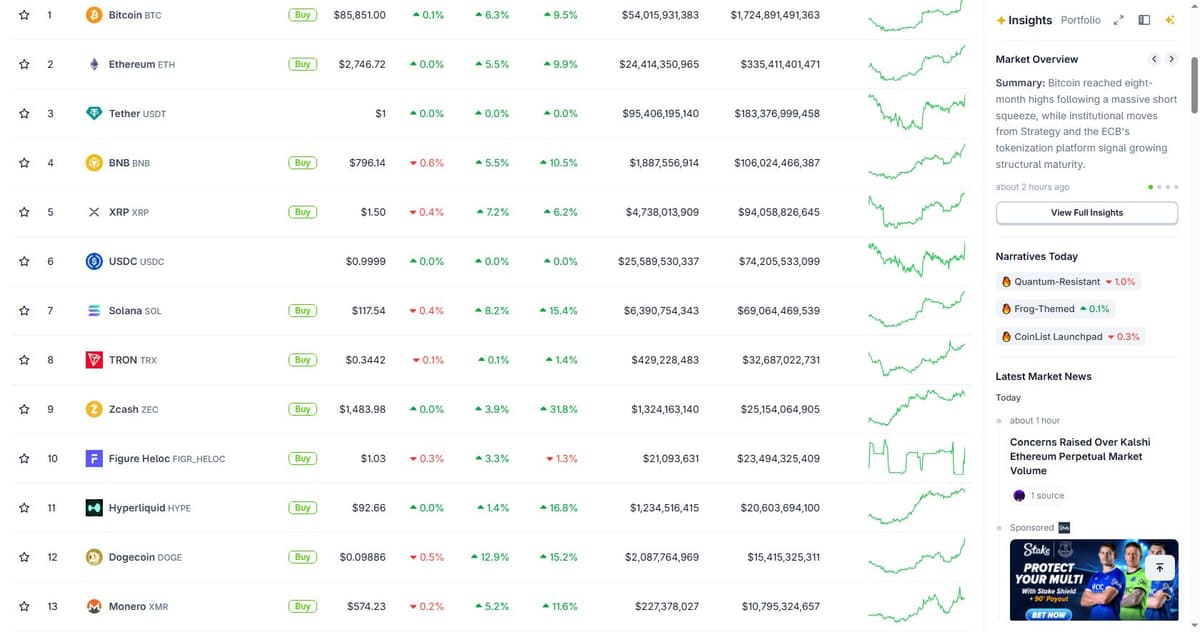
Both tokens are moving alongside a broader market that’s sharply green today: Bitcoin is at $85,851 (+6.3% on the day), Ethereum at $2,746.72 (+5.5%), Solana at $117.54 (+8.2%), and BNB at $796.14 (+5.5%).
The rally is tracing back to the same catalyst chain behind Bitcoin’s own break higher this week: the Senate’s September 15 failure to advance the CLARITY Act was followed within 48 hours by the SEC and CFTC issuing their own crypto guidance, and the market has been re-rating the sector upward ever since rather than treating the stalled bill as a setback.
Leverage Is Doing Real Work Here Too
CoinGlass shows XRP’s 24-hour futures volume at $291.6 billion, up 88.6% on the day, with open interest up 7.9% to $158.3 billion and 24-hour liquidations up 183.9% to $920.3 million.
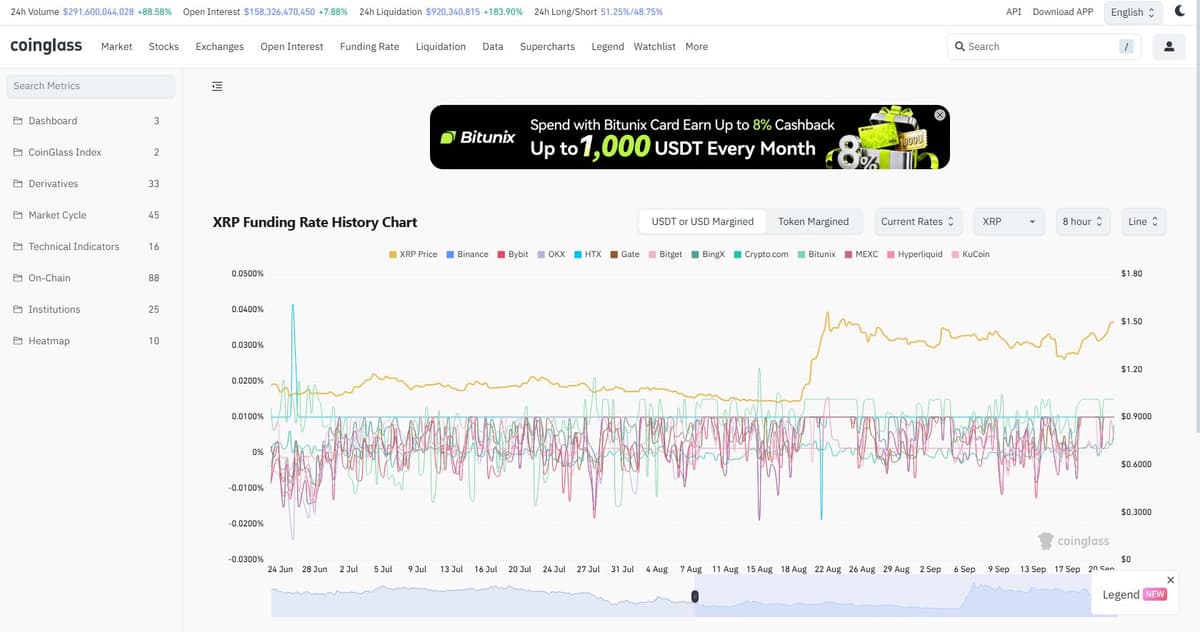
The long/short split sits close to even at 51.25% to 48.75%, so this reads as broad participation on both sides of a fast move rather than a one-sided squeeze. That’s consistent with a real market re-rating a sector higher, not a thin, leverage-only spike in a single token.
The Levels That Actually Matter From Here
For XRP, $1.50 is the round-number trigger, but the real test is the $1.53-$1.55 zone just above it, the same zone that has turned this token back three separate times since late August. Clearing it on real volume would open the way toward the token’s next visible supply zone in the high-$1.60s to $1.80s, based on where the last leg up ran out of buyers before this month’s pullback. Getting rejected there again would put the $1.25-$1.30 zone from September 15 back in play.
For XLM, the breakout is already in hand. Holding the old $0.195-$0.20 range as support on a pullback is what would confirm it as a genuine trend change rather than a one-day spike; losing that zone again would undo the move.