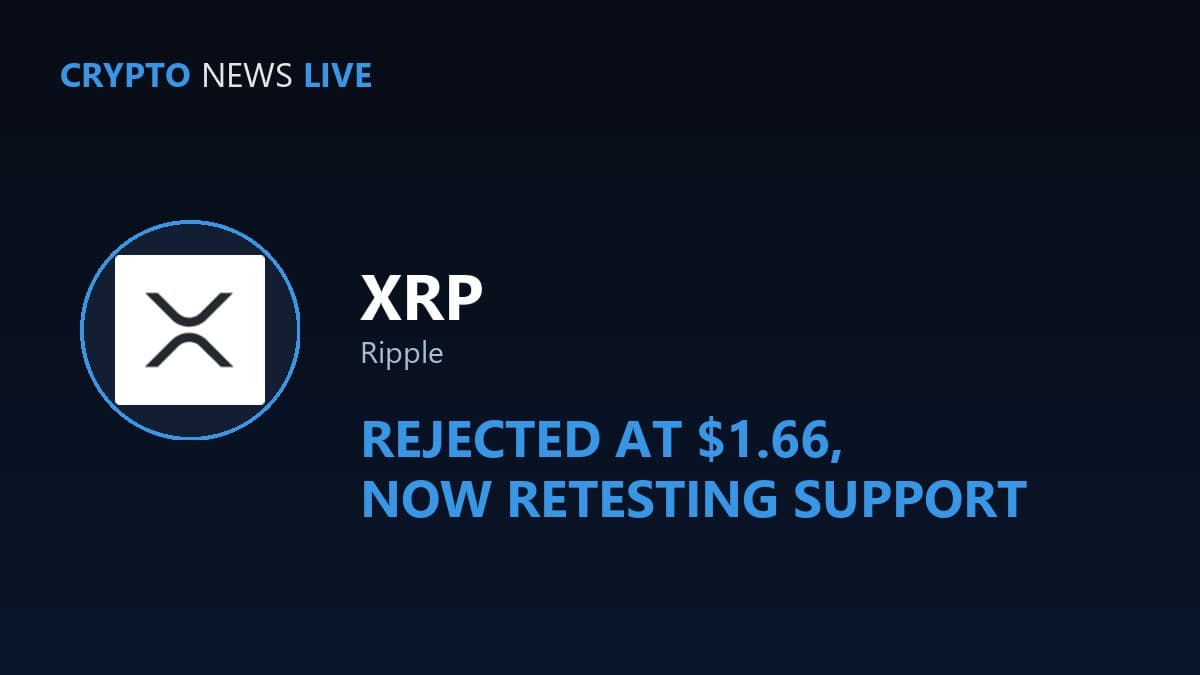
XRP put in one of its sharpest moves of the year over the past two weeks. It bottomed under a dollar, ripped 68% in four trading days, then got turned back hard at resistance. It’s spent the week since giving a chunk of that gain back.
The Move Nobody’s Debating Anymore
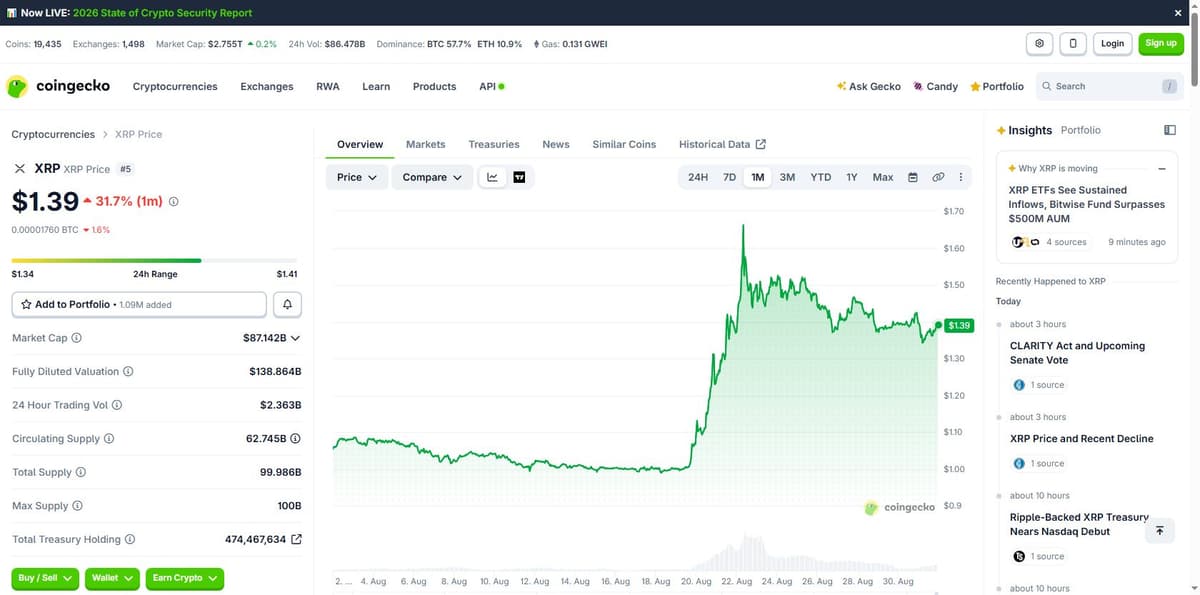
XRP bottomed at $0.99 on August 18, 2026, per CoinGecko’s own hourly price data. From there it ran in almost a straight line. It peaked at $1.6625 in the early hours of August 22, a 68% gain in under four days.
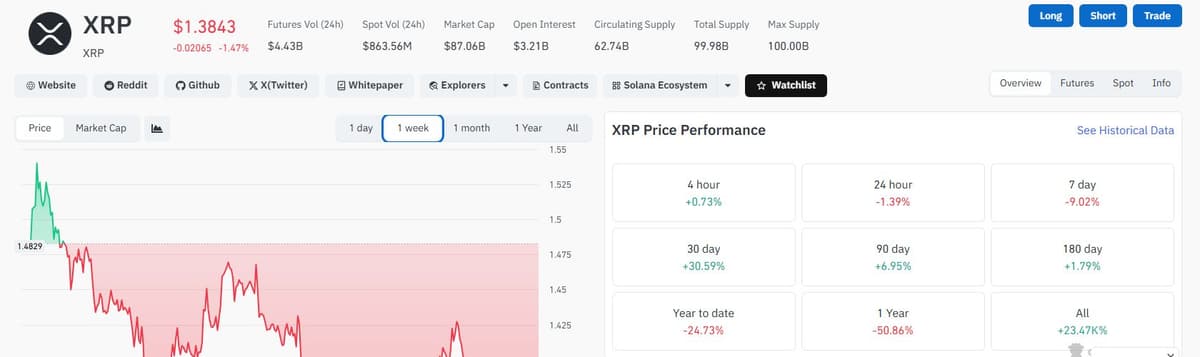
That kind of vertical move doesn’t happen on light conviction. Price has since pulled back to $1.39. Still up 31.7% over the trailing month, but clearly rejected somewhere it couldn’t hold.
What Actually Lit the Fuse
The rally lines up with a real Washington event, not just chart momentum. On August 19, President Trump hosted a group of crypto and finance executives at the White House. He publicly pushed Congress to pass the Digital Asset Market Clarity Act, the market-structure bill that would draw a federal line between which digital assets count as securities and which count as commodities.
Ripple CEO Brad Garlinghouse was in the room. So were Coinbase’s Brian Armstrong, Kraken’s Arjun Sethi, and SEC Chairman Paul Atkins. Garlinghouse and a smaller group had already met separately with Commerce Secretary Howard Lutnick to press the same case before the wider meeting, according to The Washington Times.
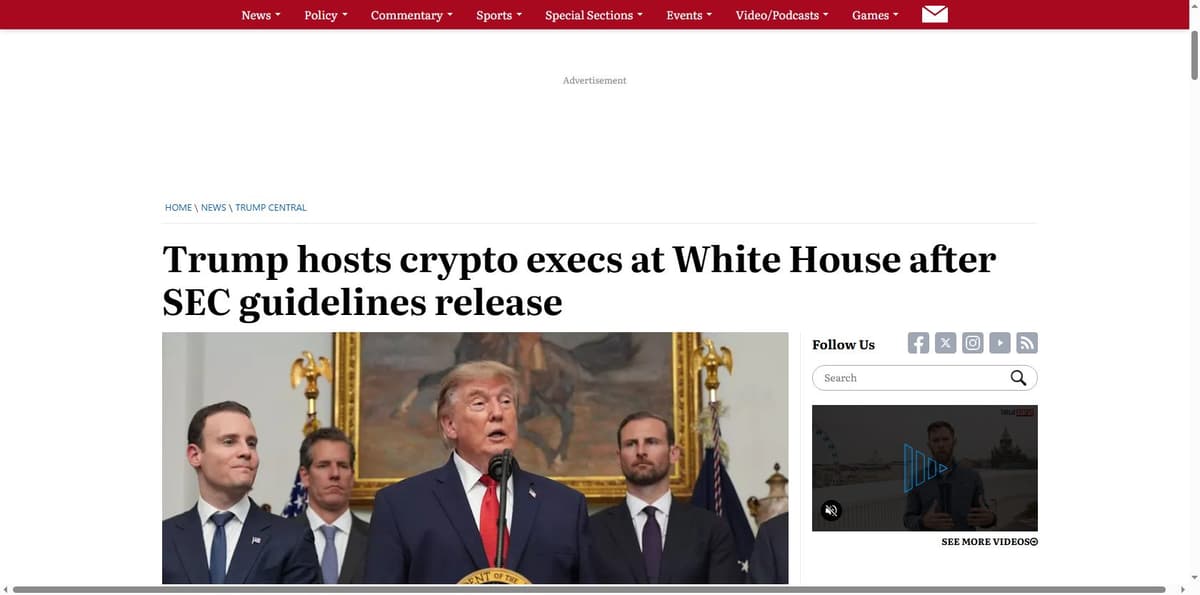
The bill itself isn’t new. It cleared the House back in 2025 and has been stuck in the Senate ever since. What changed is a sitting president standing in the Oval Office next to Ripple’s own CEO, calling for a Senate vote on it directly. For a token that spent years defined by its own SEC lawsuit, that’s a different kind of headline than a routine ETF-flow update. It’s also the likely reason XRP outran the rest of the market during that window instead of just riding a broad risk-on day.
The Zone That Turned It Back
XRP didn’t fail at a round number. It failed inside a specific supply zone between roughly $1.55 and $1.70 that had already been marked as resistance before price ever got there. That’s visible on a weekly chart of the move, where the rally’s final candles stall out and reverse directly inside the shaded band.
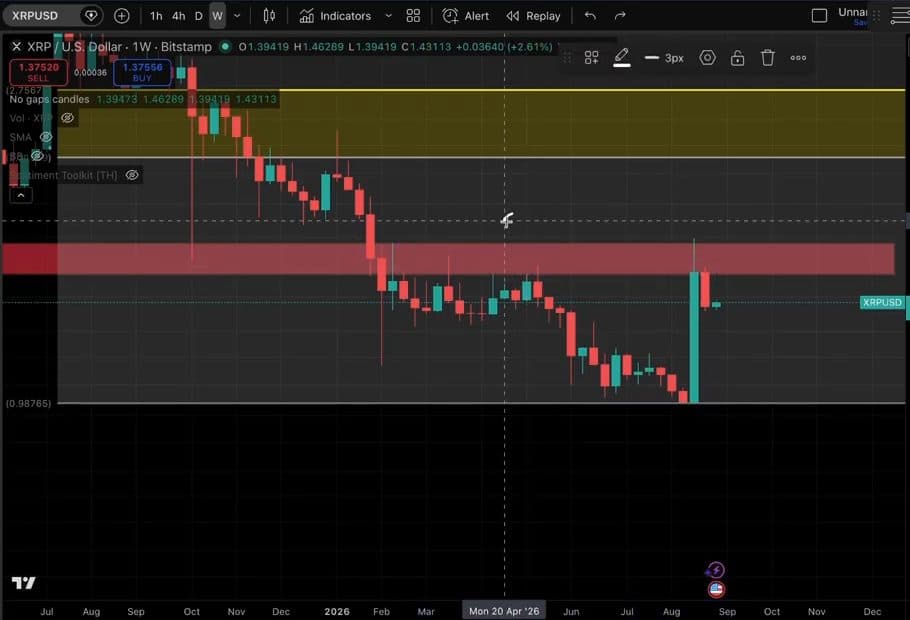
Getting rejected at a level flagged before the fact is a different story than getting rejected at some arbitrary spot. Sellers were already positioned there, waiting, instead of showing up as a surprise. Consistent with a market that ran hard on real news but hadn’t cleared the supply sitting above the old range.
A Reset Building Underneath the Pullback
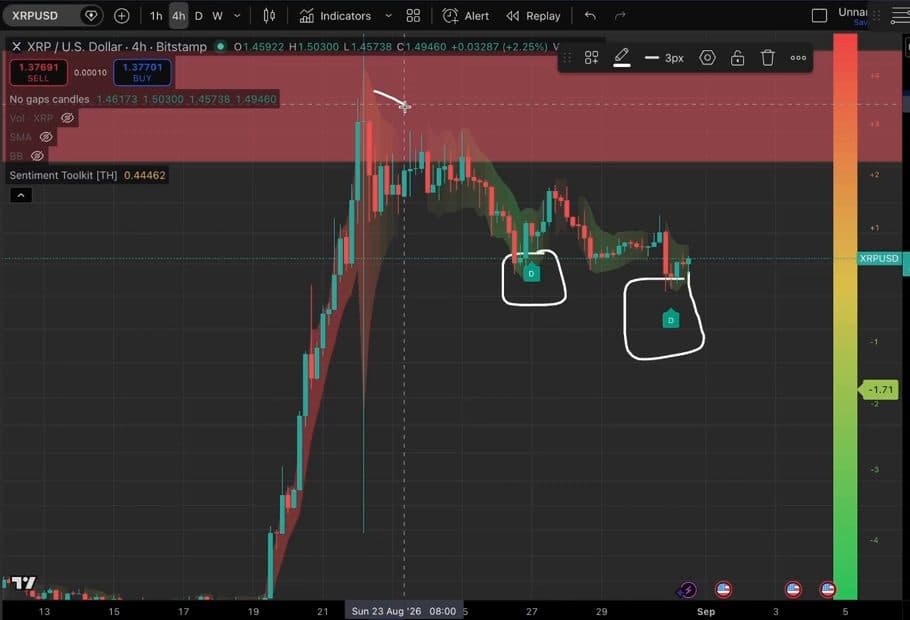
The pullback itself doesn’t look like indiscriminate selling. On lower timeframes, price has been putting in a pattern of shallow bounces on down candles. Each leg lower loses momentum before extending, then finds a small pop before rolling over again. That’s usually a sign of buyers absorbing supply on the way down, not the market simply falling out of bed.
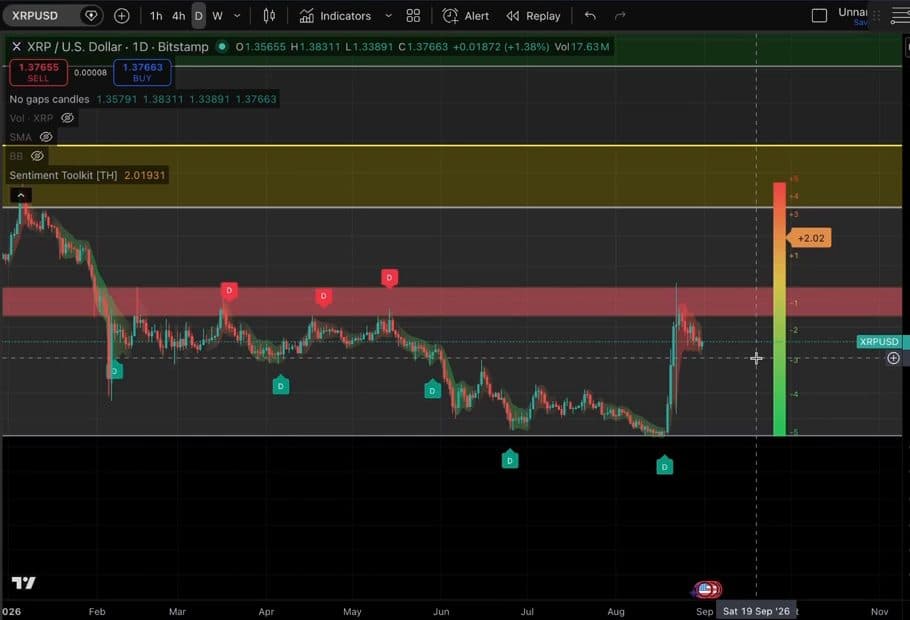
A momentum read on the daily timeframe tells the same story from a different angle. It spiked to near its most overbought reading of the month during the vertical move, and has since reset sharply back toward neutral as price cooled off. That’s the kind of fast unwind that happens when a crowded, over-extended move deflates in an orderly way instead of capitulating.
What the Derivatives Board Shows
Open interest in XRP futures sits at roughly $3.22 billion. In the past 24 hours, futures volume ran $4.48 billion against just $866 million in spot volume, per Coinglass. Futures traders, not spot buyers, are doing most of the talking right now.
Coinglass’s own tracker says the market is “still adjusting.” Fits a move that spiked hard, got rejected, and is now working through a two-sided unwind rather than a clean trend either way.
Where That Leaves It
Nothing about this pullback undoes the catalyst. The Clarity Act push is still an open, live story. A Senate vote hasn’t happened yet, and a version of that headline was still trending as fresh news at the time of writing.
What’s happened since August 22 looks like a market that ran too far, too fast, into a resistance zone that was already spoken for. Now it’s working off that excess. Whether the next real test of $1.55 to $1.70 goes any differently than the last one is still an open question.