A Nine-Session Streak Just Broke
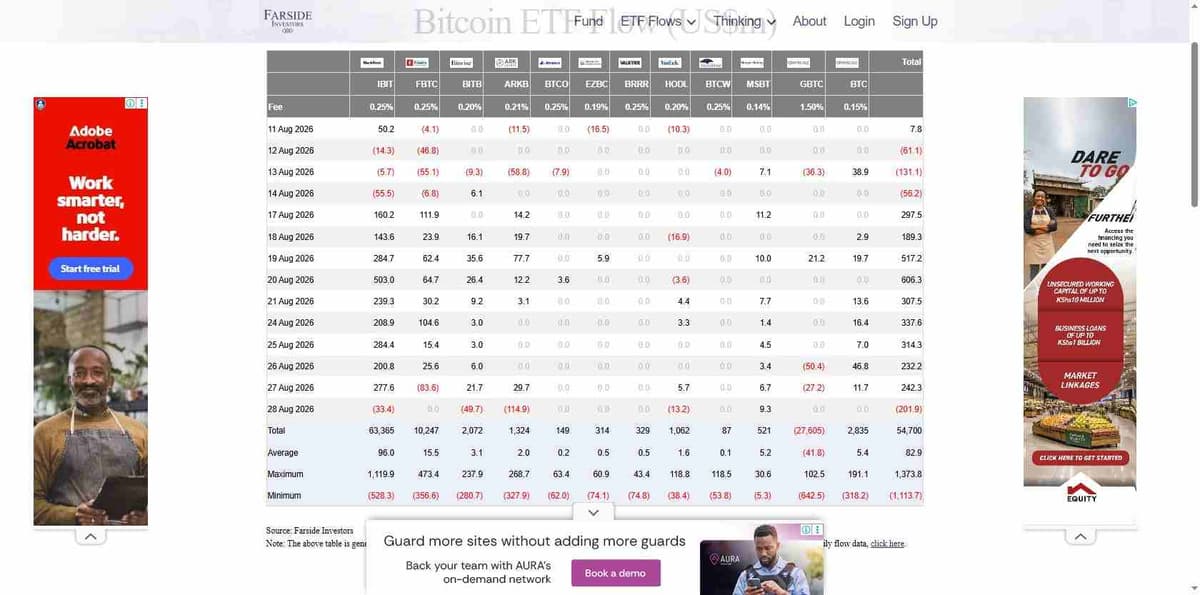
Something quietly snapped on Friday. Spot Bitcoin ETFs logged a net outflow of $201.9 million on August 28, 2026, the first red day after nine straight sessions of inflows, according to Farside Investors’ own daily flow table. Most of the headlines went straight for the $BTC short squeeze instead.
It landed the same day $BTC printed its roughest single session in weeks. A New York-open low near $78,920 turned into a squeeze up to $81,455, then a slide back toward $77,500 by Saturday. Order matters here. The outflow didn’t cause the reversal. It showed up right as the reversal was already underway, and that’s worth sitting with for a second.
What Actually Triggered Friday’s Move
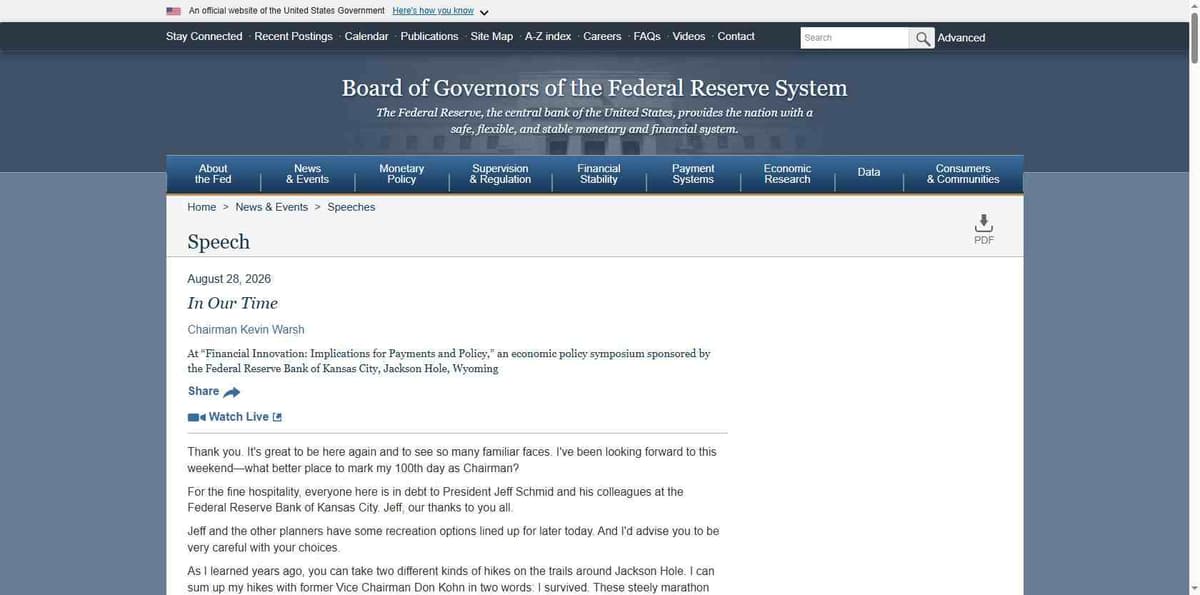
The trigger wasn’t a Bitcoin-specific event at all. Fed Chair Kevin Warsh gave his first Jackson Hole address on Friday. He did not hand markets the dovish framing some traders had positioned for.
“We must be confident that underlying inflation is moving to our objective, clearly and at sufficient speed. Otherwise, we have work to do,” Warsh told the Kansas City Fed’s economic symposium, in remarks published directly on the Federal Reserve’s own site.
Markets reacted fast, and not just in crypto. The 2-year Treasury yield jumped 11 basis points to 4.34%, a one-month high. Traders started pricing in a real shot at a near-term hike. CME-tracked odds of a rate increase at the Fed’s next meeting rose from roughly 35% to 60% within hours. The dollar index gained 0.6% to 99.66.
Gold and silver had been grinding to fresh highs right up until the speech. Both gave a chunk of it straight back, fast.
Gold’s Reversal Was Real
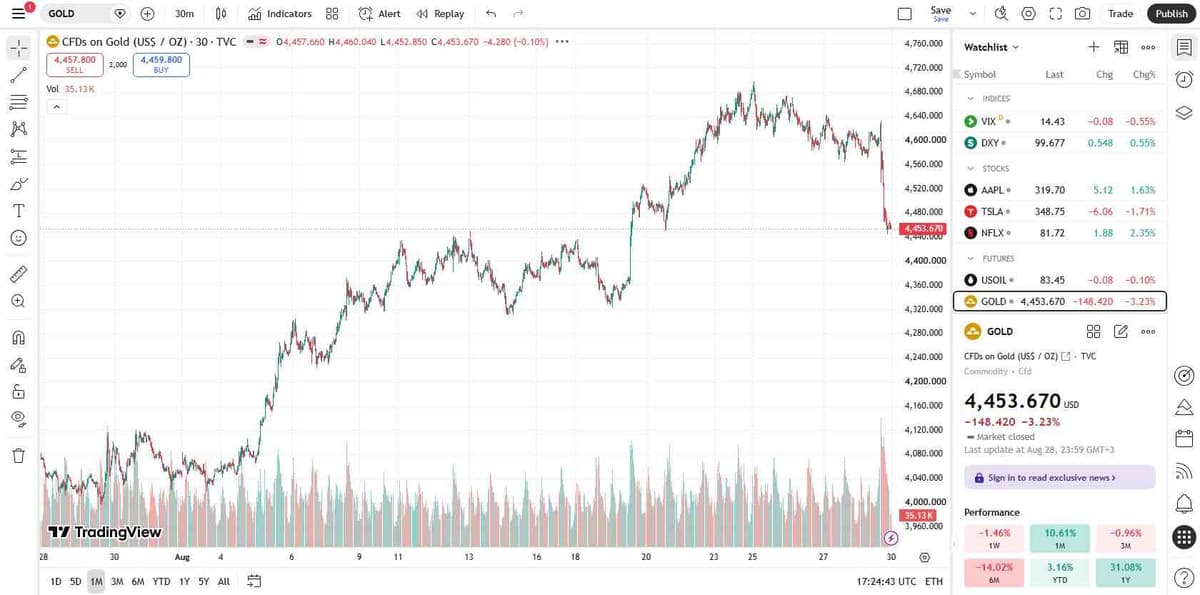
Gold rallied from the low $4,300s in early August to an intraday peak near $4,700 by August 24. By Friday’s close it had fallen to $4,453.67, down 3.23% on the day, per TradingView’s own CFD chart for the metal. That’s not the kind of drop that happens on a quiet Friday.
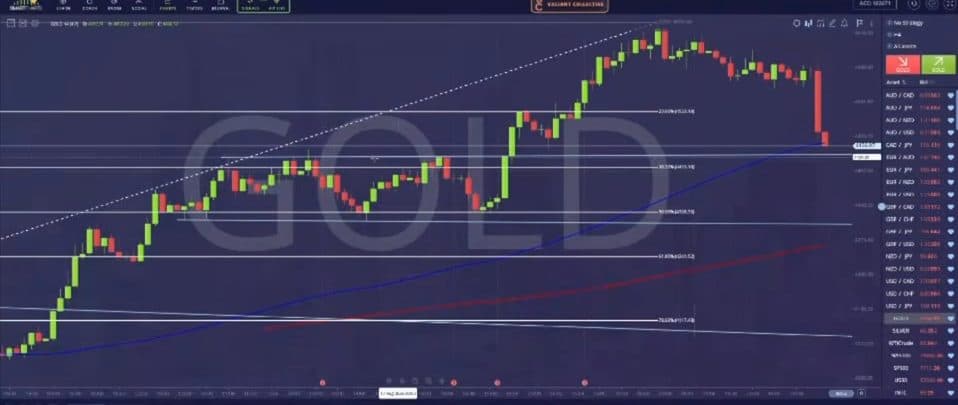
Zoomed into a Fibonacci grid, the pullback lines up with a real technical zone, not some random air-pocket. The reversal is landing close to the 38.2% retracement of the prior leg up. The 50% level sits just below as the next line in the sand.
Silver moved even harder in percentage terms. Down 4.21% to $66.33 on the same tape, right after clearing $70 for the first time all week. A rally built on the idea the Fed was basically done tightening ran straight into a Fed chair saying, in effect, not yet.
Where Bitcoin Actually Sits Now
$BTC’s move looks similar on the surface. A sharp reversal off a fresh high. But the mechanism underneath is different, and that part’s worth separating out.
The rally to $81,455 wasn’t mainly a spot-buying story. It followed a Treasury buyback operation that triggered forced short covering in perpetual futures, the kind of move that piles on paper gains fast and gives them back just as fast once the squeeze runs out of steam. That’s a different animal from real demand walking in the door. It also lines up with ETF flows turning negative the moment the squeeze topped out, rather than confirming a breakout.
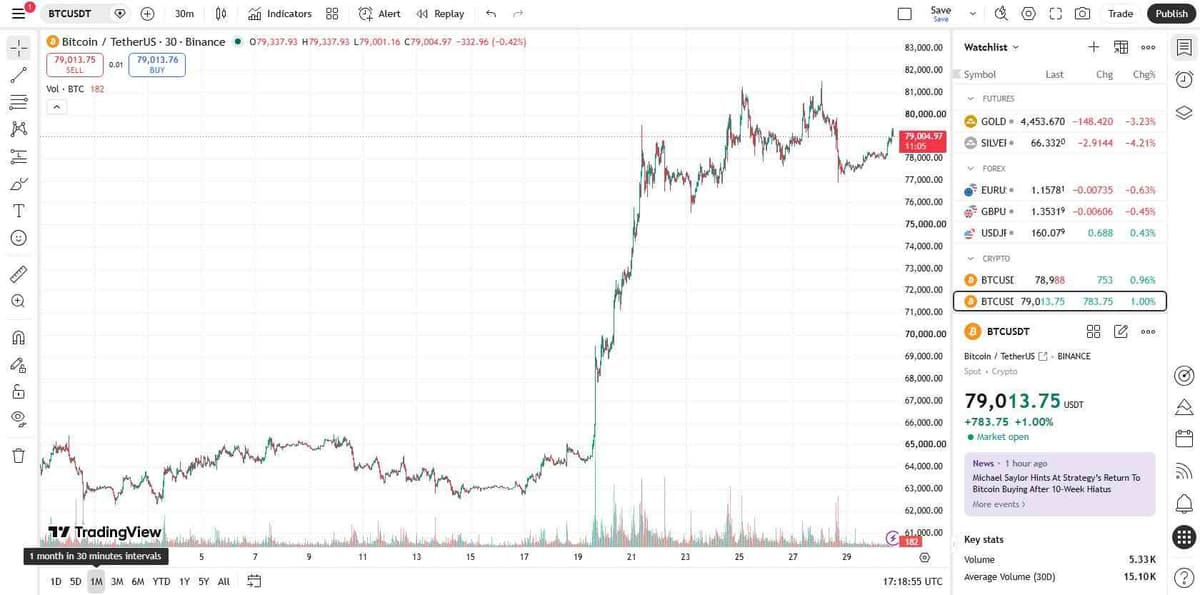
As of this chart, per TradingView’s live BTC/USDT feed, $BTC was trading around $79,000. That’s comfortably inside the $77,000 to $78,000 support band that formed after the pullback. Lose that band and the downside risk gets real again. Reclaim $80,000 on actual volume, not another futures squeeze, and that’s the level that would genuinely argue the correction is done.
The Week Ahead Carries More Weight Than Usual
US non-farm payrolls land this Friday. After a Warsh speech that repriced rate-hike odds this hard, that release matters more than a routine monthly print normally would. A weaker number would undercut the case for a near-term hike, and could hand gold, silver, and Bitcoin some of Friday’s losses back. A strong one does the opposite.
None of this settles itself by Monday. Warsh’s own language, “committed to a discipline, not to a decision,” was deliberately vague on timing. Markets read the tone as hawkish anyway. For now the tape across metals and crypto is behaving exactly like that read was right.