Bitcoin jumped about 2% in the first 40 minutes after the August PCE inflation data landed on Wednesday, September 30. By 14:32 UTC it had given back the whole move and a little more.
The Bureau of Economic Analysis (BEA) published the report at 8:30 a.m. Eastern, which is 12:30 UTC. The PCE inflation data looked softer. But the report also carried a rewrite of how BEA measures prices, and that changes how much of the softness to trust.
The Spike And The Round Trip
Binance spot BTC/USDT closed the 12:29 UTC minute at $83,939.61. The high came at 13:09 UTC at $85,649.95, up 2.04% from that print.
The low after the peak was $83,373.00 at 14:32 UTC. That is 2.66% under the high and 0.68% below where the market stood before the release.
Ether drew the same shape on Binance. ETH/USDT went from $2,703.59 to a $2,738.51 high at 12:56 UTC (+1.29%), then down to $2,668.00 at 14:35 UTC (-2.57%).
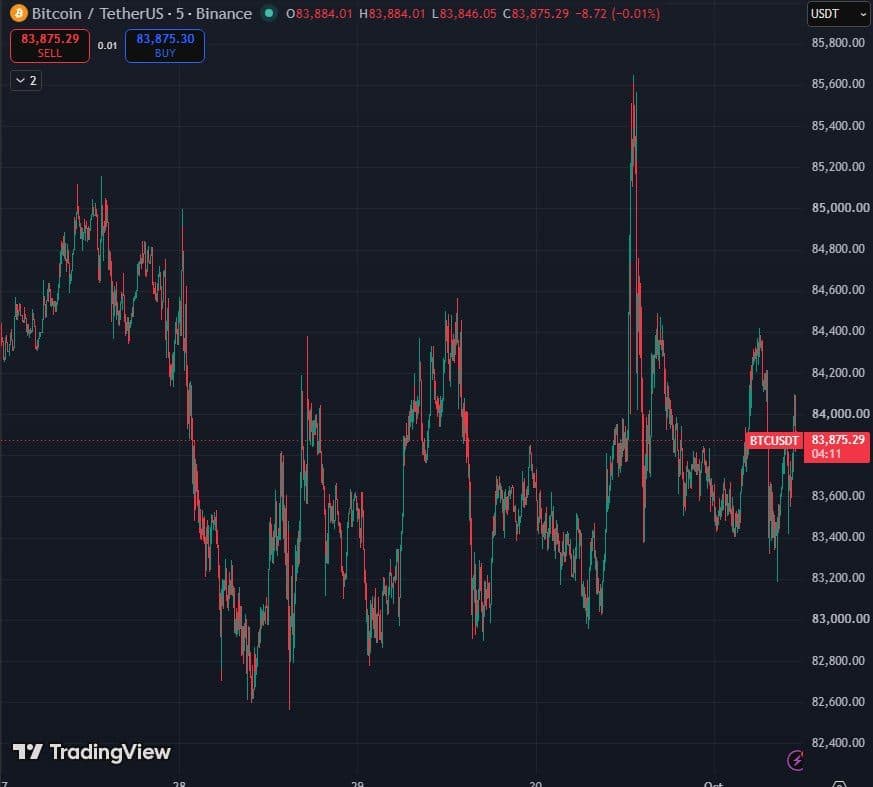
The whole round trip took about two hours from the release to the low. As of 11:00 UTC on October 1, the Binance perpetual traded near $83,755, almost exactly where it stood before the report.
What BEA Changed In The PCE Inflation Data
The PCE inflation data itself was mild. BEA put the August PCE price index up 0.3% on the month and 3.4% on the year. Excluding food and energy, the core index rose 0.2% on the month and 3.0% on the year.
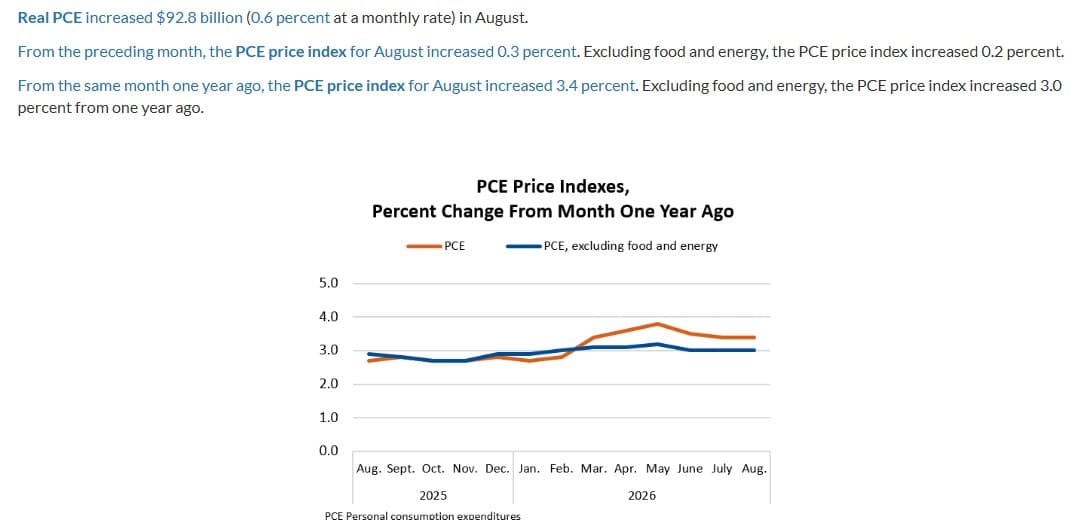
The same release carried the annual update of the national accounts. BEA said its methodology changes focus mainly on how it deflates several consumer spending categories, notably portfolio management and investment advice, legal services, and computer software and accessories.
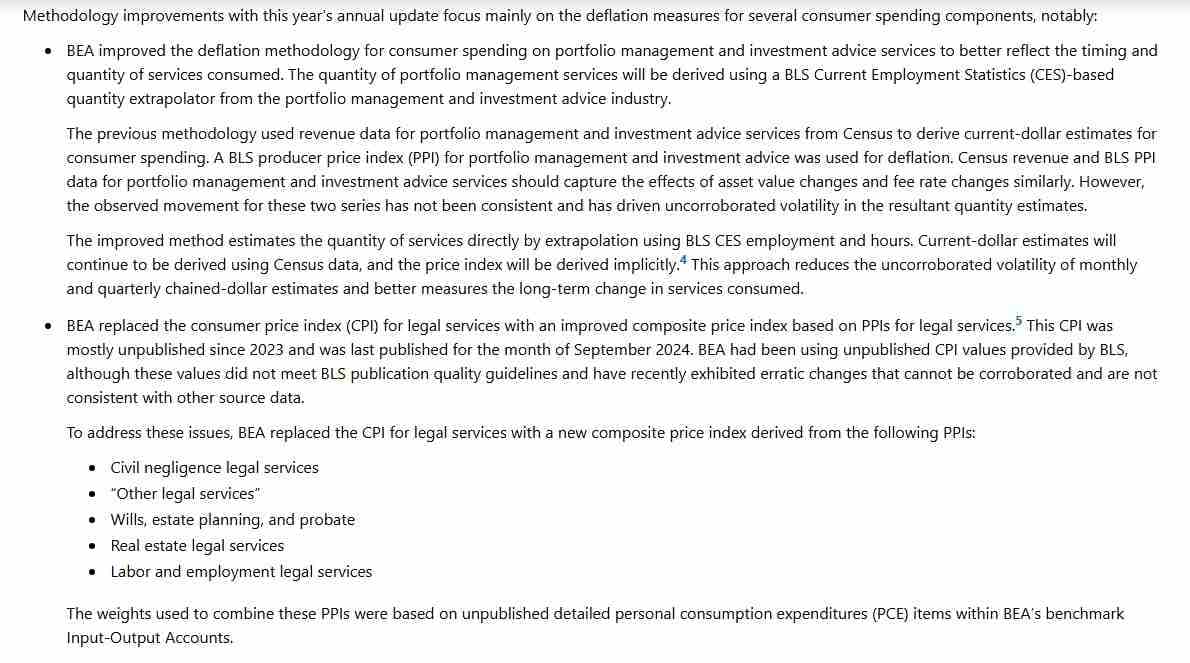
The adviser fee change is the big one. BEA wrote that its old approach, built on Census revenue and a producer price index, had “driven uncorroborated volatility” in its quantity estimates. The new one measures the quantity of services from BLS employment and hours, and the price is derived implicitly.
As we read that, a fee that rises with asset values no longer has to show up as a price increase. BEA gives no worked example, so that part is our reading, not BEA’s wording.
Legal services lost a CPI series that BEA said had been mostly unpublished since 2023. Software now uses a composite of one CPI and two PPIs.
How Much Cooler Did The Revision Make It?
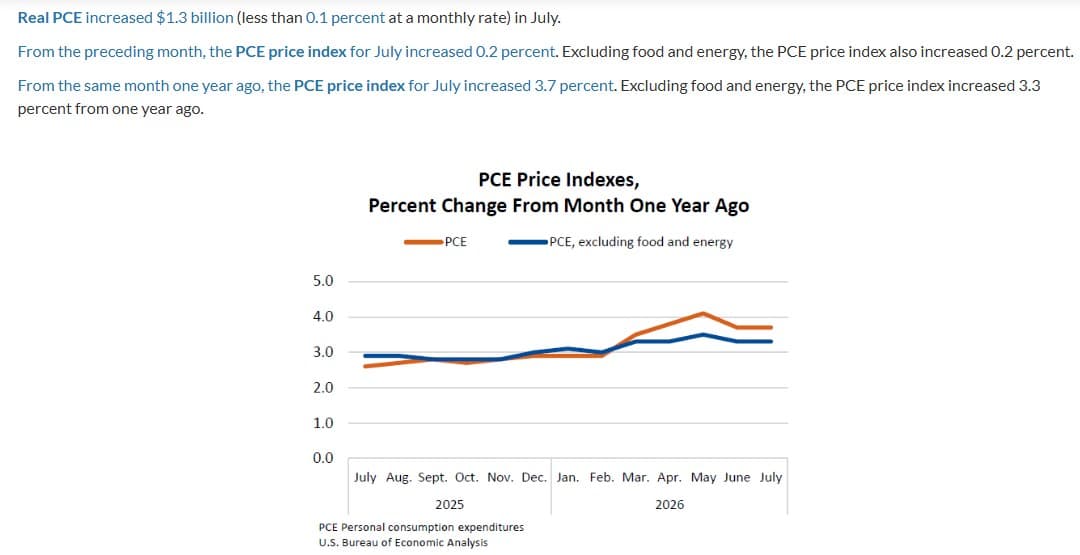
BEA’s first read of July, published August 26, had core PCE up 0.2% for the month and 3.3% over twelve months.
The revised PCE inflation data tells a different story. In FRED’s core PCE price index, July 2026 reads 130.133 against 126.363 a year earlier. That works out to 2.98%.
August reads 130.455, or 3.01% over the same 12 months, which matches BEA’s 3.0%.
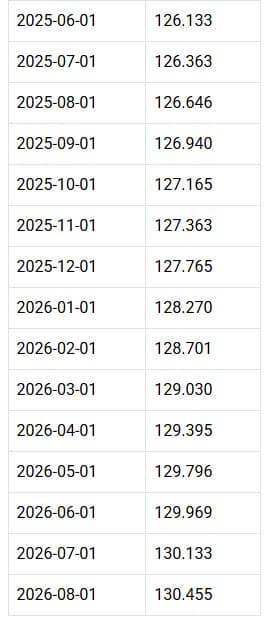
So July’s annual core reading moved from 3.3% to about 3.0% in a single release. The release page does not say how much of that came from the three deflator changes and how much from new source data in the same update. Any outside estimate of the split is an estimate, not a BEA number.
Spending And Growth Came With The PCE Inflation Data
The PCE inflation data was not the only number that day. Nominal PCE rose 0.9% in August, a $190.8 billion jump, and real PCE rose 0.6%. Real disposable income was flat at 0.0%.
The same day, BEA’s third estimate put second-quarter GDP growth at 2.2% annualized. That is a 0.7 point upgrade from the second estimate.
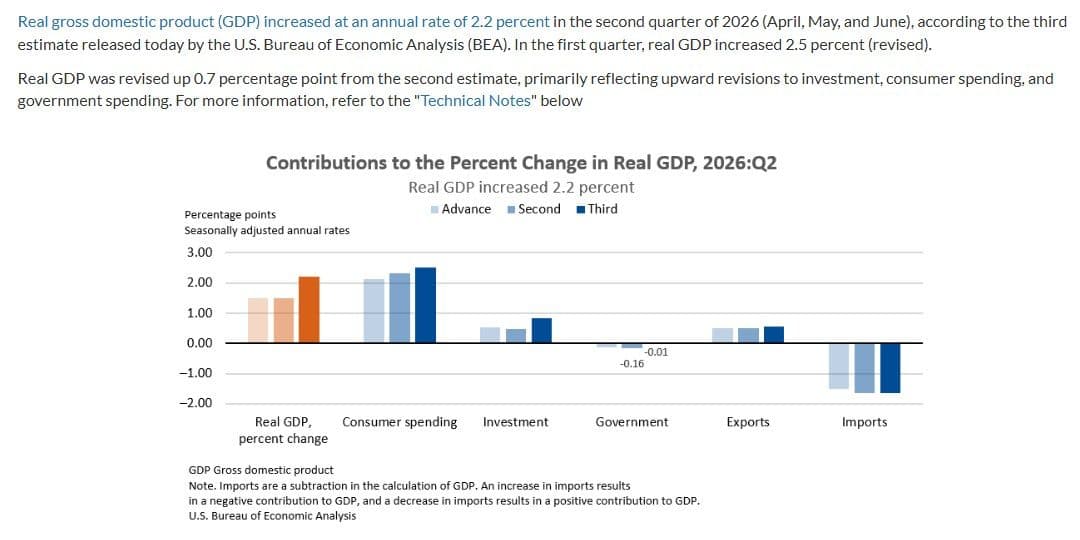
Cooler measured prices next to stronger spending and growth is not the clean easing signal the price line alone suggests.
Three Possible Reasons Bitcoin Gave It Back
Nobody can prove why a two-hour reversal happened. These are the readings the data supports, each labelled POSSIBLE, none CONFIRMED.
First, the softer core rate was partly a measurement effect. Once desks read the methodology note, some of the cooling may have been marked back down.
Second, the activity data cut the other way. A 0.9% spending month and a 0.7 point GDP upgrade argue against fast easing.
Third, the spike ran up through a stack of earlier highs. On the Binance perpetual, 4-hour equal highs sit at 85,004.93 (September 28) and 85,185.20 (September 27), and the spike stalled just under $85.7K. Price then fell back through all of it. That is what happened. We cannot say why.
What Flows And Positioning Showed After The PCE Inflation Data
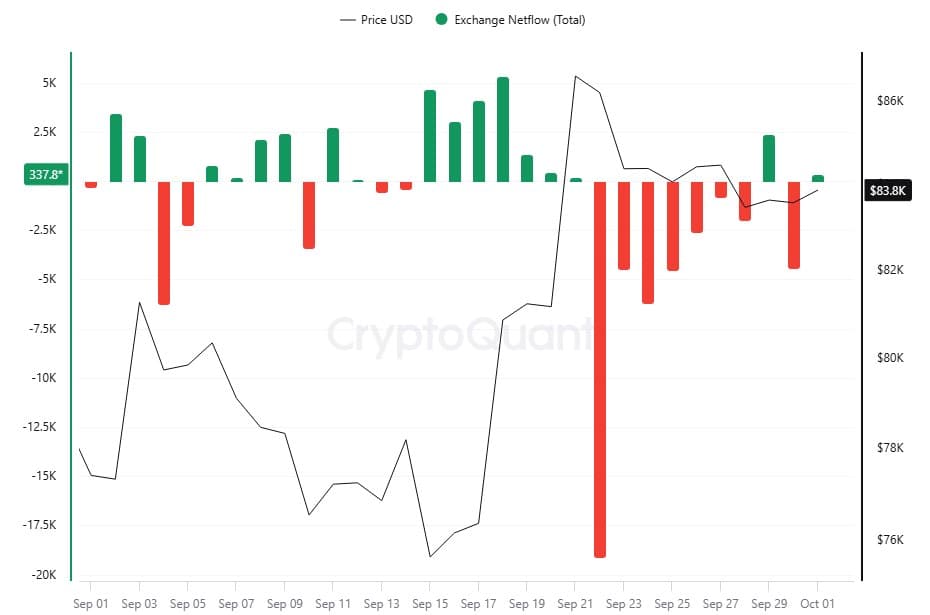
CryptoQuant’s all-exchange BTC netflow for September 30 was a net outflow of roughly 4,500 BTC, read off the chart’s scale. Coins left exchanges on the day of the spike and the fade. The October 1 bar was still partial, at +337.8 BTC when we looked.
CoinGlass lists total BTC futures open interest at $53.25 billion, up 0.74% in 24 hours, with Binance at $11.04 billion. Binance USDT-margined funding for the last three 8-hour prints was 0.0066%, 0.0080% and 0.0046%.
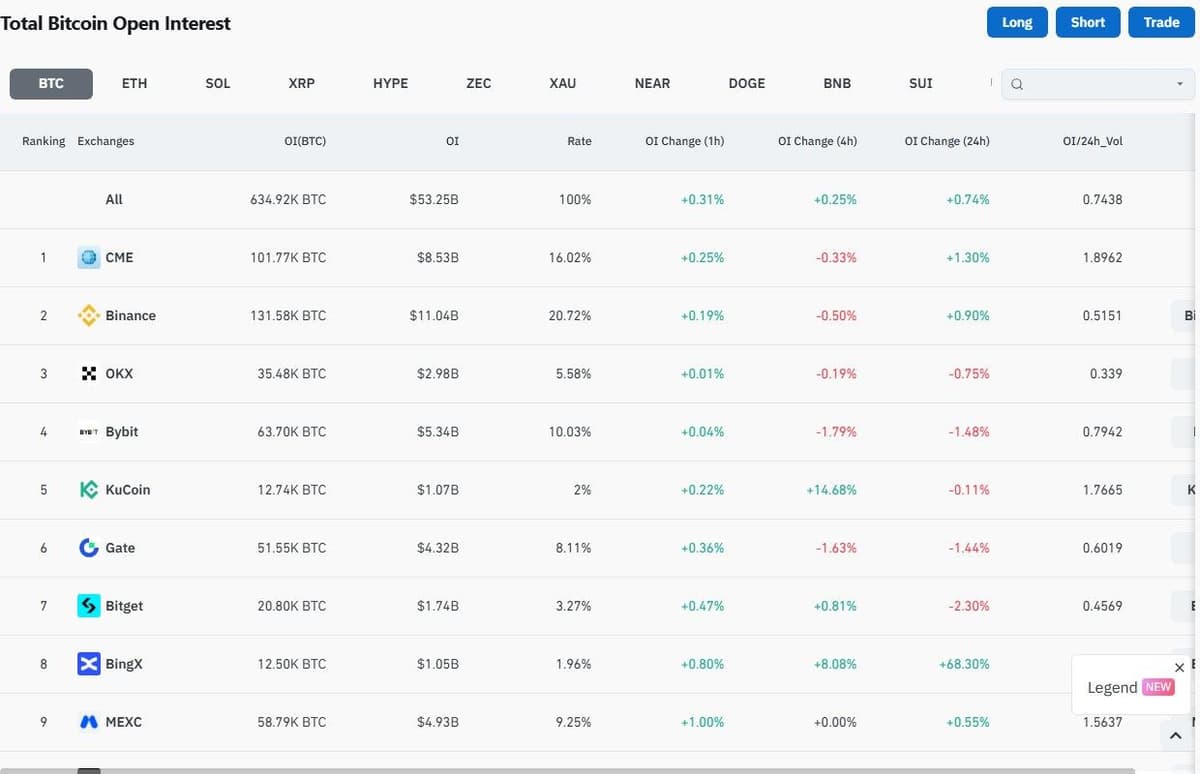
These are snapshots as of October 1, 2026, not signals.
Levels And Scenarios After The PCE Inflation Data
Regime: BTC sits above its 100-day average, about $70,517, and price is inside its range, 4.2% under the 20-day high. All levels below are from the Binance USDT-M perpetual as of 11:00 UTC on October 1.
Up scenario: a 1-hour close above $84,379.80, the October 1 high and the month’s high, opens $85,004.93 and then $85,185.20. A 1-hour close back below $83,957.90 cancels it.
Down scenario: a 1-hour close below $83,576.80, the October open, opens $83,136.60 and then $82,901.30. A 1-hour close back above $83,994.68 cancels it.
Further out, the September 30 perpetual high is $85,632.70 and the September 21 high is $87,385.10. Below, the 4-hour low cluster is at $82,612.20 and the prior week’s low is $80,819.40.
The evidence is balanced. Price is back at its pre-release level, inside a range and above its long average, and neither trigger had fired at 11:00 UTC. This is analysis, not financial advice.
What To Watch Next
BEA lists the next personal income and outlays release, covering September, for October 29, 2026 at 8:30 a.m. Eastern. It will be the first monthly PCE inflation data print after this annual update, so any later revision pattern will be easier to see.
Until then, the two triggers above are the cleaner test of whether the post-release range holds.