$BTC is trading almost exactly where it was three days ago, chopping in an $83,800–$85,100 band after a sharp break higher earlier this month. Nothing dramatic happened over the weekend.
But three real data points landed in the same window, and taken together they say more about the liquidity backdrop than any single flat candle does.
The Chart: A Breakout, Then A Pause
BTC spent June through August rebuilding after a hard June selloff, grinding through a $62,000 to $67,000 range for weeks. In mid-September it broke out violently, tearing from roughly $72,000 to an intraday high near $87,000 in a matter of days.
Since that spike, price has done almost nothing. The three-month chart below shows the move and the pause that followed it.
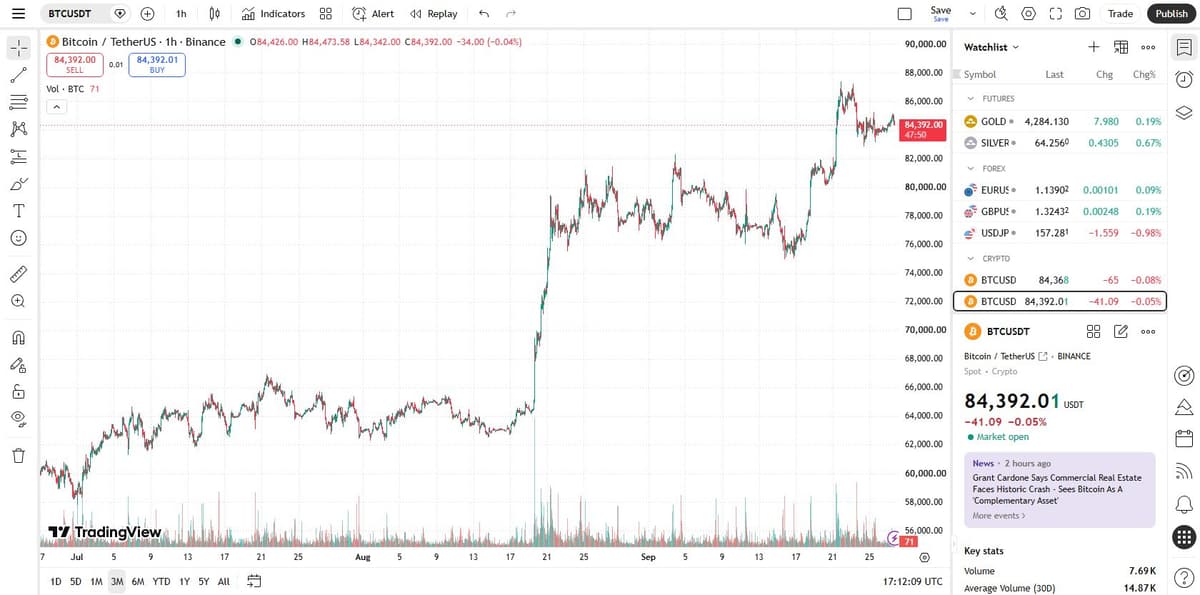
A vertical move like that followed by two weeks of sideways chop is a normal digestion pattern, not automatically a top. Whether it resolves higher or lower likely depends on the macro backdrop underneath it, which is where the real news this week actually sits.
US Business Activity Just Hit A Five-Year High
On September 23, S&P Global’s flash US Composite PMI printed 58.4, a 62-month high, up from 56.0 in August.
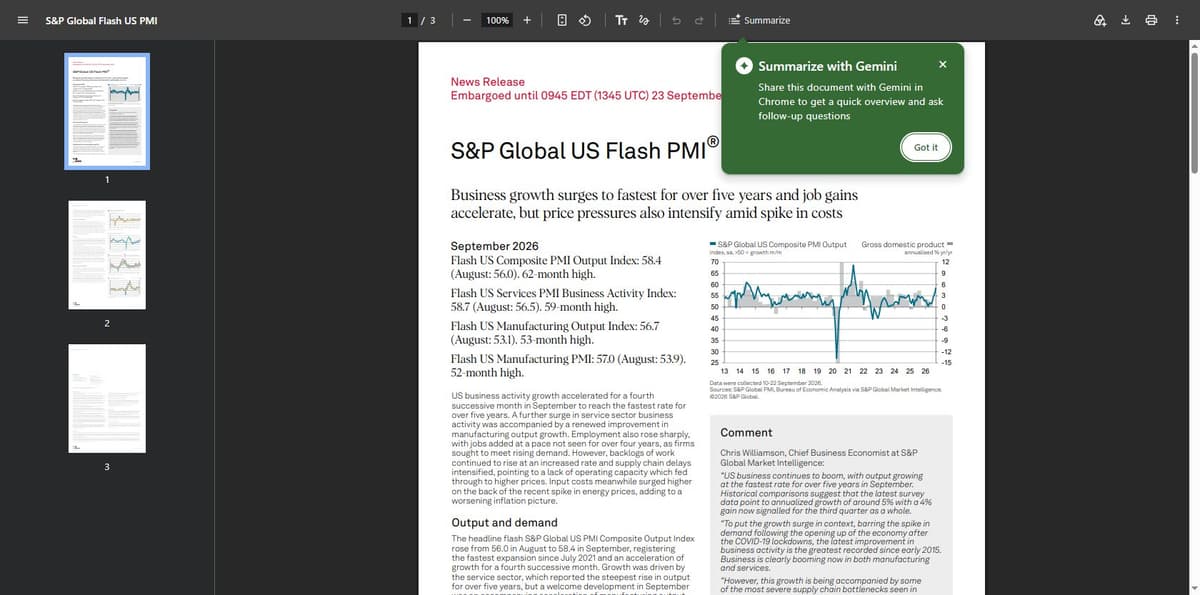
Chris Williamson, S&P Global’s Chief Business Economist, called it the fastest output growth in over five years and said the survey data points to annualized GDP growth of around 5%. Services led the move, with the services PMI hitting a 59-month high of 58.7, while manufacturing output expanded at its fastest pace in 53 months.
That is a dated, independently reported acceleration in US economic activity, not a recycled talking point.
Household Income And Poverty Numbers Hit Records Too
The US Census Bureau released its annual income and poverty report on September 15, and the headline numbers are genuinely record-setting. Real median household income reached $87,460 in 2025, the highest figure on record dating back to 1967, a 2.6% rise from 2024.
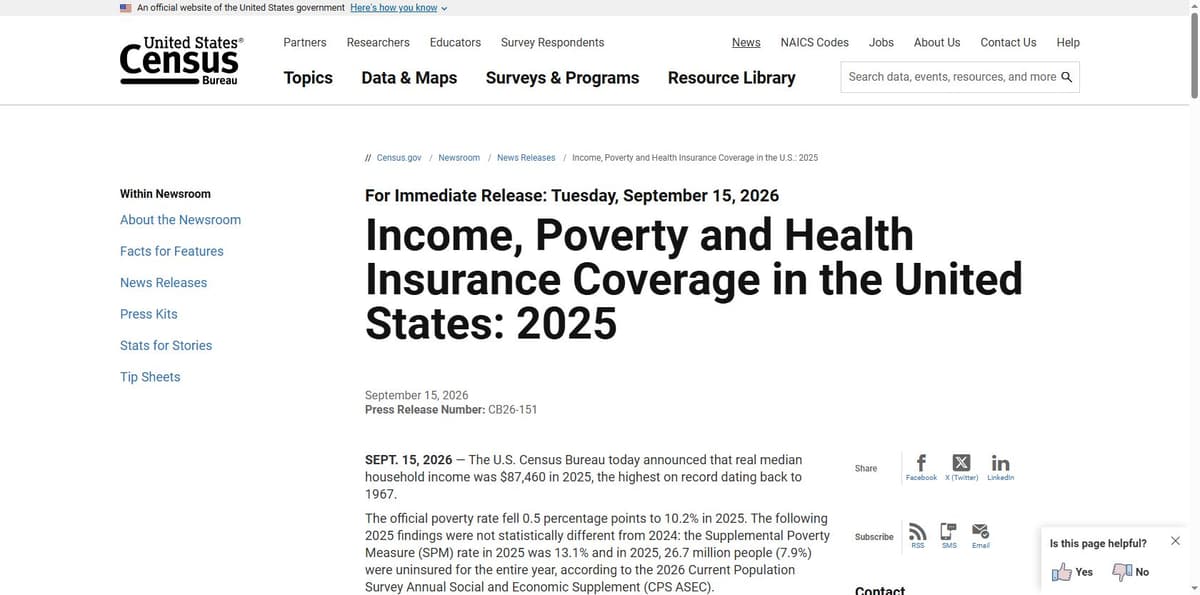
The official poverty rate fell 0.5 percentage points to 10.2%, and child poverty dropped to a historic low of 13.4%. The uninsured rate held at 7.9%, statistically unchanged from the prior year.
These are Census Bureau figures covering the full 2025 calendar year, not a single quarter’s snapshot.
What The Futures Market Is Actually Pricing In
None of this tells the crypto market what to do next, but it does describe the backdrop $BTC is trading against. On that front, positioning still leans constructive rather than fearful.
The Crypto Fear & Greed Index sits at 70, squarely in “Greed” territory, and has held in the high 60s to low 70s for the past month.

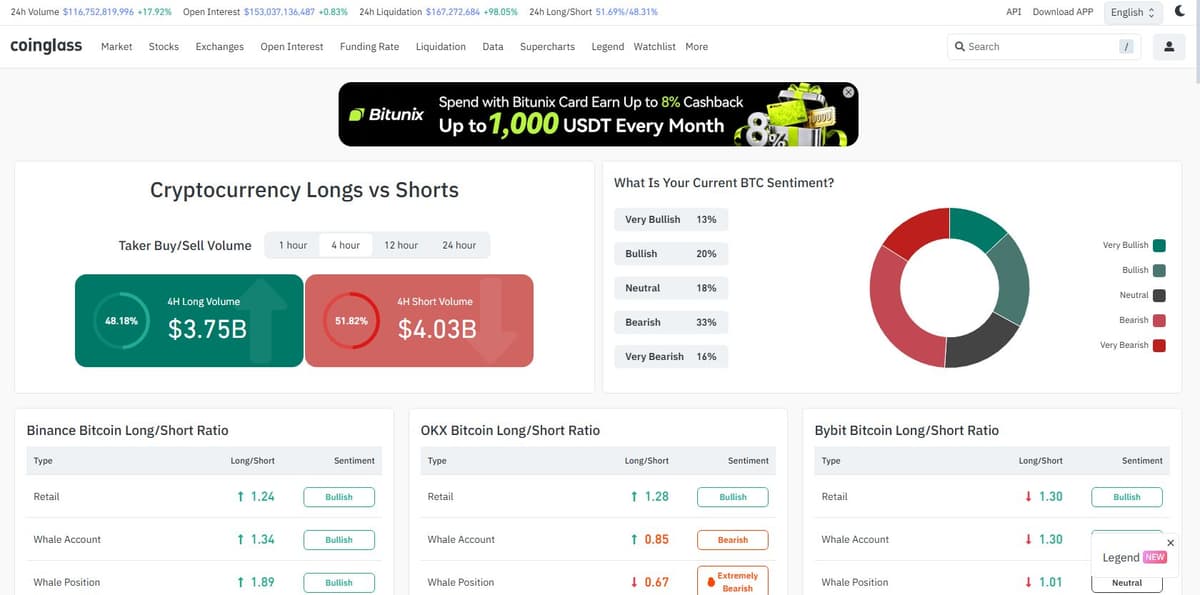
Binance’s own BTC long/short data shows retail traders running a 1.24 long-to-short ratio, whale accounts at 1.34, and whale futures positions even more skewed long at 1.89. BTC’s open-interest-weighted funding rate sits at a mild 0.0012%, positive but not stretched, meaning longs are paying shorts a small premium to stay positioned rather than the market being extremely crowded in either direction.
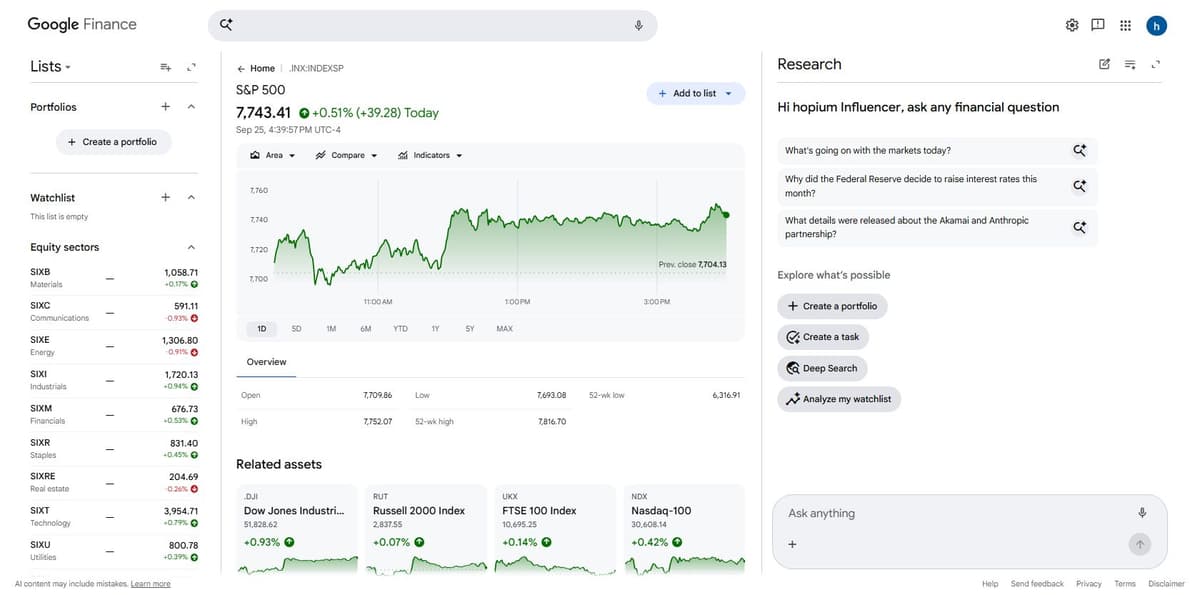
Equities have not exactly rolled over either. The S&P 500 closed last week at 7,743, within about 1% of its 52-week high of 7,816.70, and the Nasdaq-100 sits at 30,608.
The Takeaway
$BTC’s own chart looks like a market catching its breath after a real breakout, not one running out of road. The economic data landing around it, a five-year PMI high, a record household income print, a record-low poverty rate, and futures positioning that is bullish-leaning but not euphoric, is a genuinely constructive backdrop rather than noise.
Whether that backdrop is enough to push $BTC through its recent high, or the pause turns into something deeper, is the next thing worth watching. Not this weekend’s flat candle.