Bitcoin slips toward its old ceiling, and the bond market picked the same window to push yields to levels last seen before the financial crisis. $BTC has given back roughly $4,500 from its breakout high in three days.
The move matters less for its size than for where it stopped. Price is sitting almost exactly on the level that capped every rally for a month.
The Breakout Is Intact, But Only Just
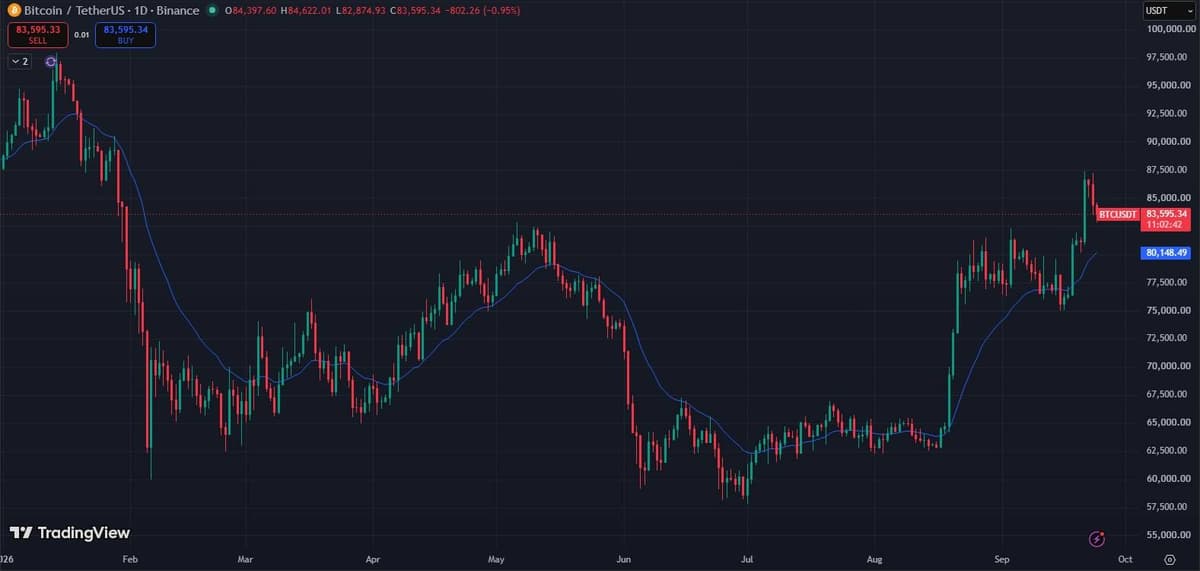
On Binance’s BTCUSDT pair, $BTC spiked to $87,396 on September 21. That day printed about 31,963 BTC of volume, the heaviest daily total of the past month. It closed at $86,620.
Since then it has bled lower. Thursday’s low so far is $82,875, a 5.2% drop from the high, with price trading near $83,500 as this went to publish.
That low sits about $575 above $82,300, the September 3 high that capped the whole range. For roughly a month, $BTC chopped between about $75,000 and that ceiling. Old resistance is now being tested as support.
Why The Next Low Matters More Than The Last High
A breakout is only half of a trend change. The other half is the pullback that follows: does it hold above what used to be resistance, or does it slide back into the range?
Three levels frame that test. $82,300 is the old ceiling. $80,850 is the low of the breakout day itself, and the 21-day EMA runs just beneath it near $80,150.
A daily close below those two would put price back inside the box it just left. That is how a breakout turns into a stop run in hindsight. Holding them keeps the higher-low structure alive.
The Liquidation Map Leans Downhill
CoinGlass’s aggregated liquidation map estimates how much leveraged positioning would be forced out at each price level. On the 30-day view, the cumulative long side below the current price reads roughly $9 billion to $10 billion. The short side above it is closer to $4 billion.
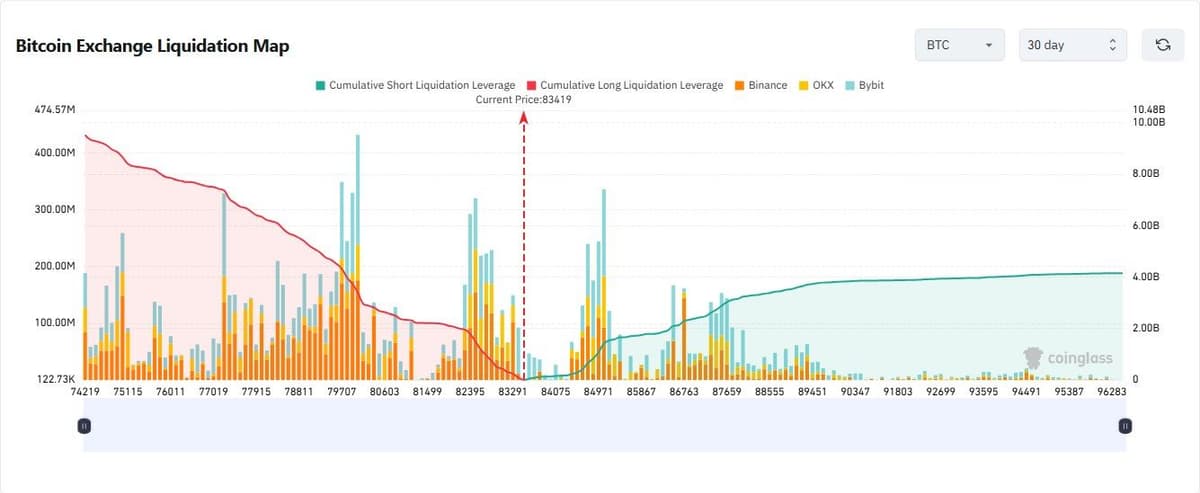
Widen the window to 180 days and the skew gets sharper. Long liquidation leverage below price climbs to roughly $16 billion, against under $4 billion of shorts above. That is about four to one.
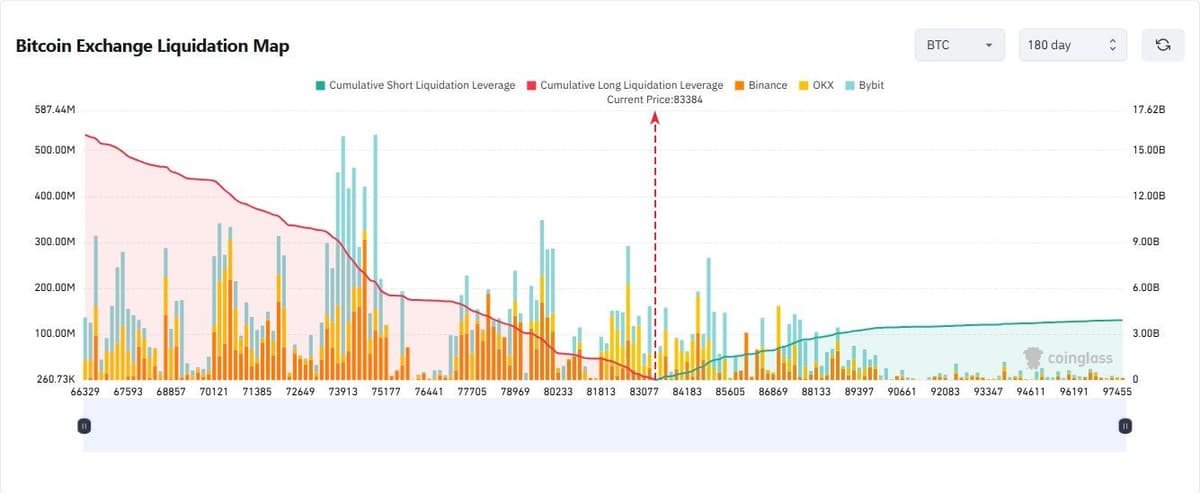
A map like this is not a forecast. It shows where the fuel is stacked. Markets tend to drift toward dense clusters, and more of that fuel sits below $83,000 than above it.
Traders Are Not Actually Euphoric
The positioning data cuts the other way. Total Bitcoin open interest fell 5.84% in 24 hours to about $57.1 billion, or roughly 684,300 BTC, per CoinGlass. Across the whole derivatives market, about $586 million was liquidated in that window, up 95% from the day before.

Funding is close to flat. The open-interest-weighted BTC rate is 0.0025%, and Bybit and KuCoin are both slightly negative. Nobody is paying a premium to be long.
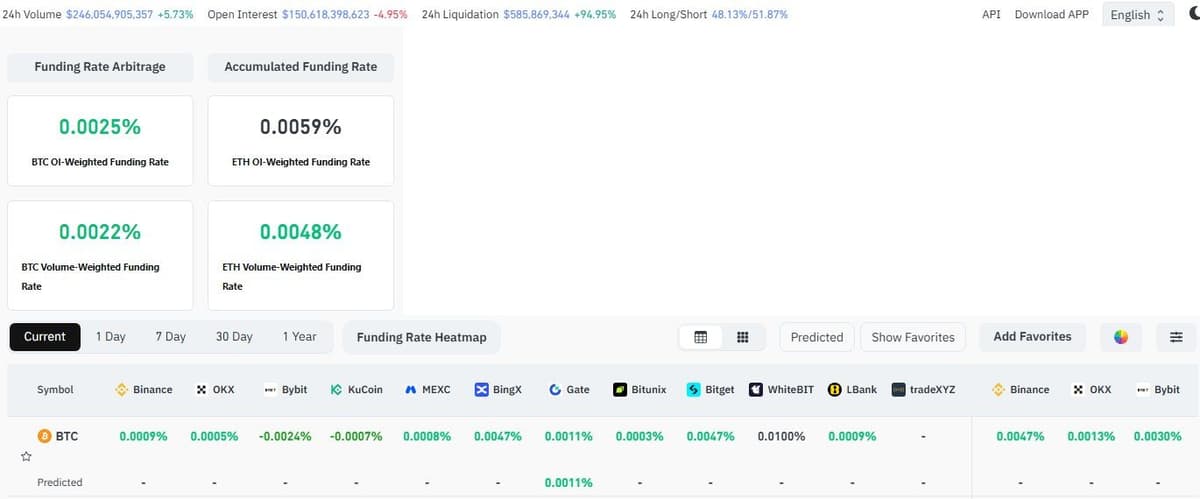
Put together, the dip shook out leverage rather than exposing a crowded long. What remains skews toward positions sitting below price, which is why the lower levels above carry weight.
Spot Money Bought The Pullback
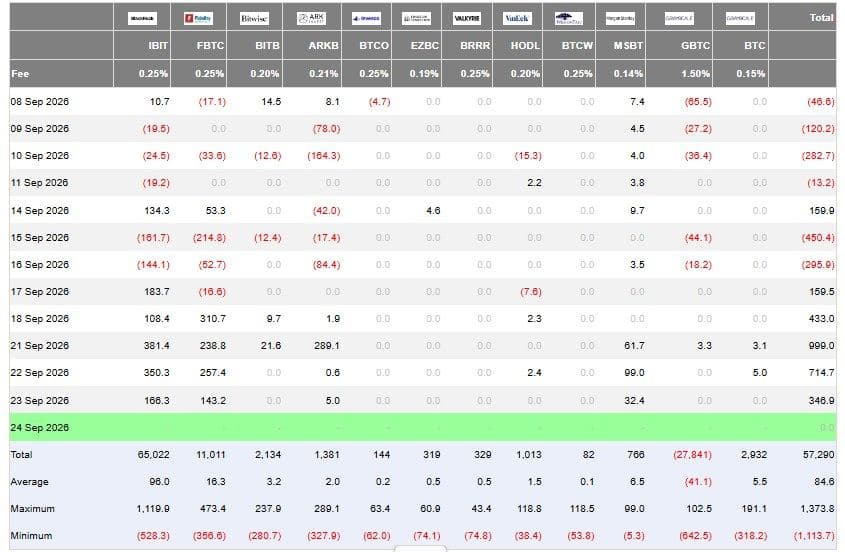
US spot Bitcoin ETFs took in $999.0 million on September 21, $714.7 million on September 22 and $346.9 million on September 23, according to Farside Investors. That is about $2.06 billion in three sessions. It followed two outflow days on September 15 and 16 worth $450.4 million and $295.9 million.
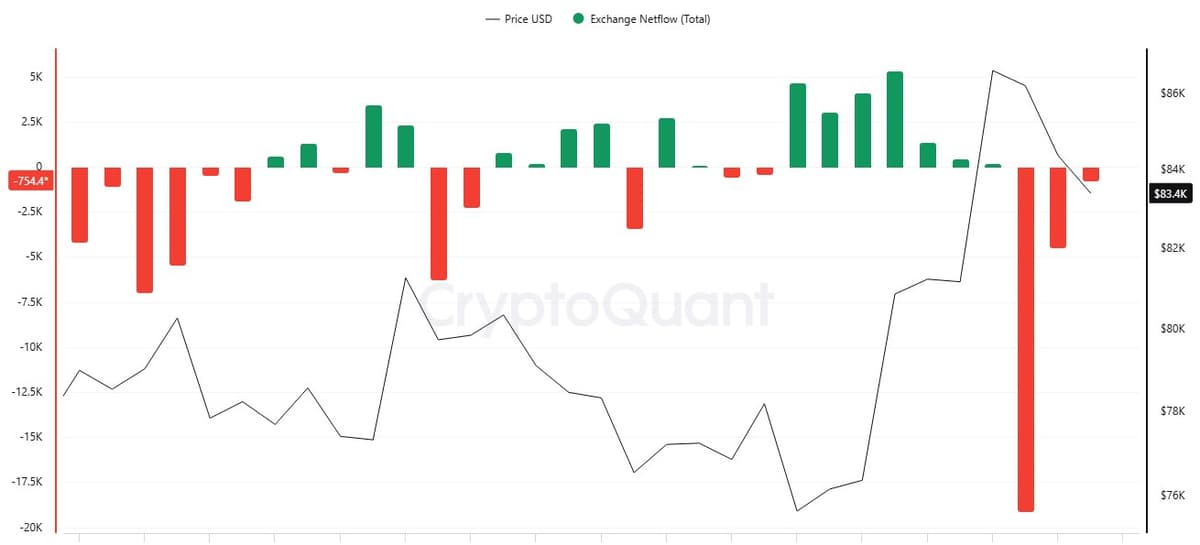
On-chain exchange flows point the same way. CryptoQuant’s all-exchange netflow chart shows one bar this week near 19,000 BTC leaving exchanges on net, the largest outflow in the past month, followed by another of roughly 4,000 BTC.
The Bond Market Is The Real Headwind
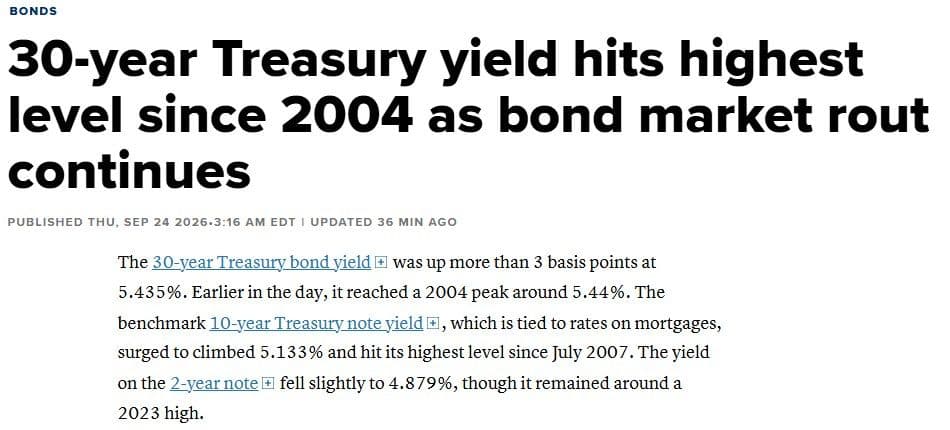
The 10-year Treasury yield climbed to 5.133% on Thursday, its highest since July 2007. The 30-year touched about 5.44%, a peak not seen since 2004. The 2-year sits near 4.88%, around a 2023 high.
Wednesday brought the 10-year’s biggest one-day jump since April 7, 2025, after stronger economic data, hawkish Fed commentary and high oil prices, CNBC reported. Traders now price better than a 75% chance of another Fed rate hike in October, up from roughly 49% a week earlier, per CME’s FedWatch tool. New York Fed President John Williams said it would be reasonable to expect another hike by year end.
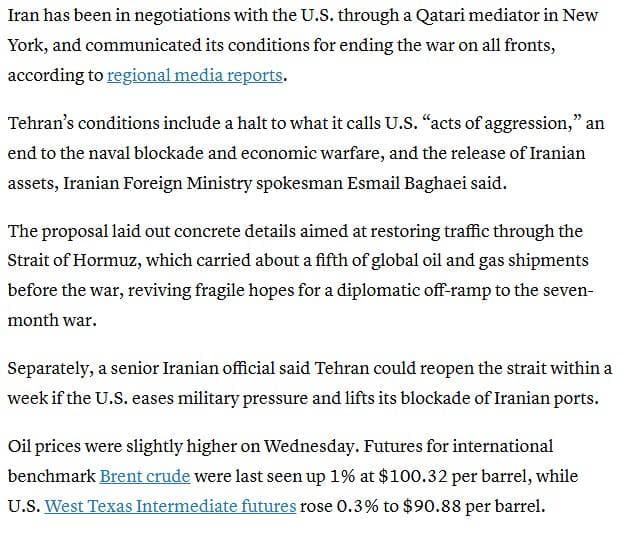
Oil is feeding that. Brent crude traded near $100.32 on Wednesday. Iran has put conditions on reopening the Strait of Hormuz, including an end to the US naval blockade and the release of Iranian assets. Kpler data cited by CNBC puts confirmed transits at about 38% of the prewar baseline. President Trump has said he expects a deal only after November’s midterms.
Higher-for-longer rates are a direct drag on risk assets. It is notable that $BTC broke out while yields were surging, and has held most of the move.
What Decides The Next Leg
The bullish case needs $82,300 to keep holding on daily closes, then a push back through $87,396. Steady ETF inflows and exchange outflows would support that.
The bearish case starts with a daily close under $80,850. From there the 21-day EMA near $80,150 is the last cushion before the $75,000 floor of the old range, and the liquidation maps show where a slide could accelerate.
The October Fed meeting is the clearest scheduled risk. If the hike odds keep climbing, the bond market, not the chart, sets the pace.