Bitcoin spent the days around the Federal Reserve’s rate hike doing something few expected: nothing much. Then on Friday it jumped 5.9% to about $80,800, and the move was fuel more than conviction.
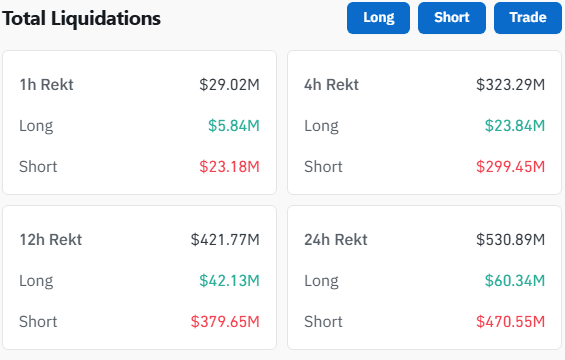
Over the 24 hours to the time of writing, traders lost $530.9 million in liquidations, and $470.55 million of that was shorts. That is nearly eight dollars of forced short buying for every dollar of longs flushed.
The Fed Hiked, and Bitcoin Barely Blinked
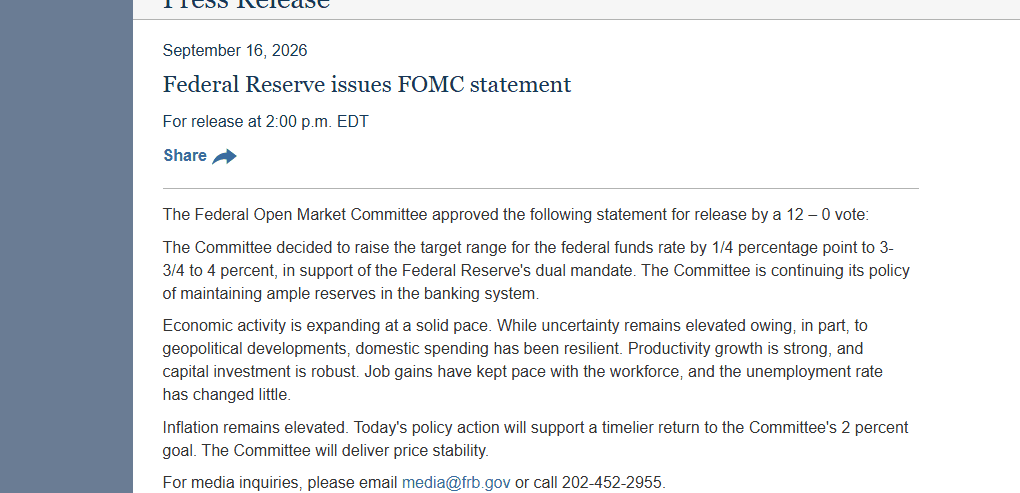
On September 16 the Federal Open Market Committee voted 12 to 0 to raise the federal funds target range by a quarter point, to 3.75% to 4%. The statement said inflation “remains elevated” and that the move will support a “timelier return” to 2%.
The selling in Bitcoin came before the decision, not after it. Coinbase daily data shows BTC falling from $78,175 to $75,584 on September 15, a drop of about 3.3%, with an intraday low near $74,890.
On the day of the hike itself it closed higher at $76,145. The day after, $76,349. The hike itself did not produce the follow-through selling the headline implied.
Spot ETFs Bled $746 Million, Then Flipped
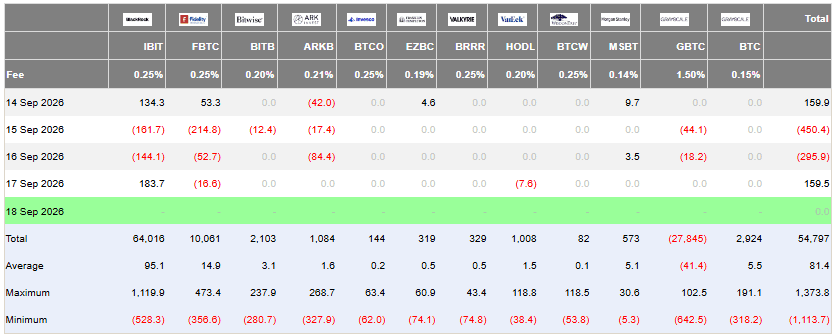
The clearest sign of nerves was in the spot Bitcoin ETFs. Farside Investors’ flow table shows net outflows of $450.4 million on September 15 and $295.9 million on September 16, roughly $746 million over the two sessions.
BlackRock’s IBIT alone shed $161.7 million and then $144.1 million. Fidelity’s FBTC lost $214.8 million on the first day.
Then the tape turned. September 17 printed a net inflow of $159.5 million, led by $183.7 million into IBIT.
Why the Hedges Matter
A JPMorgan note dated September 17 laid out why that flip may matter. The bank pointed to positioning, not price: short interest in IBIT sits near its highest level this year, while short interest in the gold ETF GLD is below its historical average.
IBIT’s put-to-call open interest ratio is also higher than GLD’s. In JPMorgan’s reading, Bitcoin ETF holders are paying up for downside protection at a rate gold holders are not.
The same note says Bitcoin ETFs have recovered only about half of their 2026 outflows since inflows returned after the Fed’s late-July meeting, while gold ETFs have recovered all of theirs.
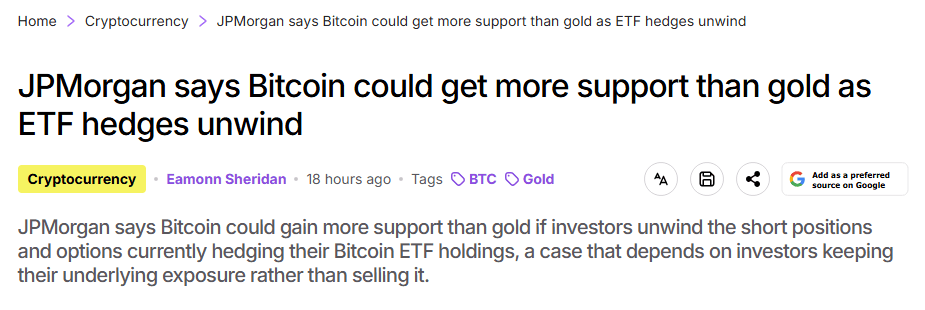
The logic is mechanical. Every short and every protective put on an ETF is a future buy order once the hedge is closed. If enough of them close at once, the unwind itself becomes demand.
JPMorgan attaches a condition, and it is an important one. The support only appears if investors are closing hedges because they feel safer while keeping their underlying exposure, not because they are heading for the exit.
The Squeeze in the Derivatives Data
Friday’s move looks like exactly that kind of forced covering. Coinglass shows $530.9 million liquidated across crypto in 24 hours, up 33% from the prior window, with $470.55 million on the short side against just $60.34 million in longs.
The four-hour window is even more lopsided: $323.29 million liquidated, $299.45 million of it shorts. The largest single order was an $8.53 million BTC-USD position on Hyperliquid, so this was broad-based pain rather than one whale.
Bitcoin open interest across exchanges was $146.5 billion, up 7.9% on the day. That means positions were being added into the move, not just closed.
The counterweight is funding. The last four Binance BTCUSDT funding prints were between 0.0069% and 0.0085% per eight hours. That is mildly positive and still below the common 0.01% baseline, so longs are not yet crowded the way they were in past blow-off tops.
What the Daily Chart Says
On Coinbase’s daily chart, Friday’s candle is the largest green bar since the August breakout. It opened near $76,350, ran to $81,253, and it reclaimed the 20-day average close of roughly $78,100 in a single session.
The ceiling is close. The 30-day high is $82,283, set on September 3, and the late-August highs sit just under it in the $81,000 to $82,000 band. Price is testing the lower edge of that zone now.
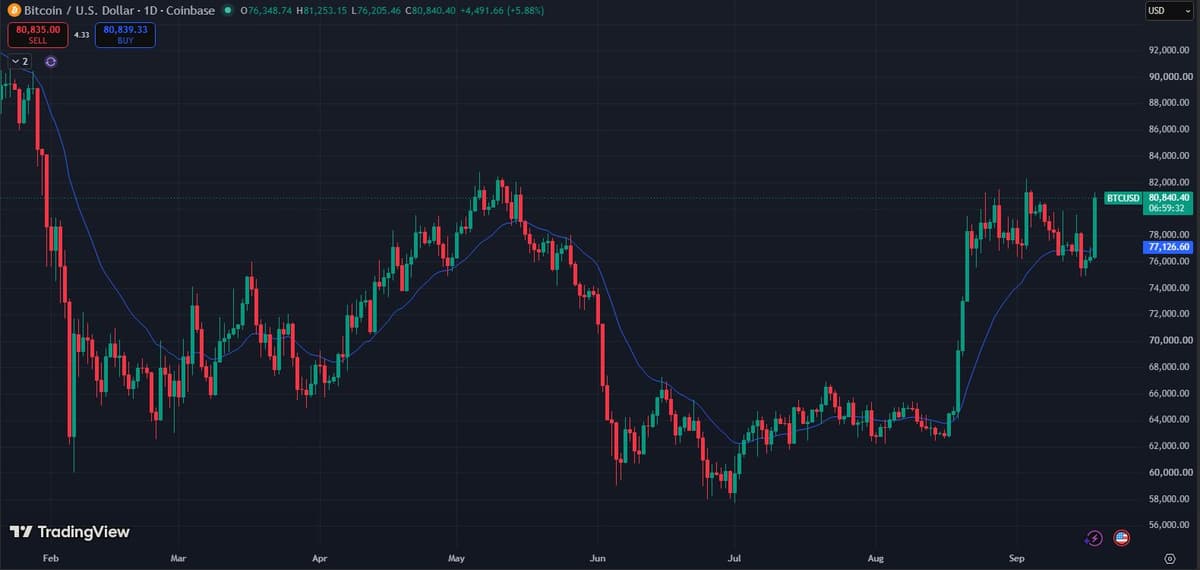
A daily close above $82,300 would put Bitcoin at a fresh multi-week high and would leave the September 15 low near $74,900 as the obvious floor for the range. A rejection here would mean the squeeze has run its course, and the move back toward the $78,000 average becomes the level to watch.
What to Watch Next
The read is that the squeeze arrived before the hedges were tested. Farside’s Monday and Tuesday numbers will show whether the September 17 inflow was a one-off or the start of a real reversal in ETF demand.
If IBIT keeps pulling in money while short interest falls, JPMorgan’s unwind scenario starts to look like a live trade. If ETF flows go back to red on a green tape, the rally is mostly liquidations and will be harder to hold.