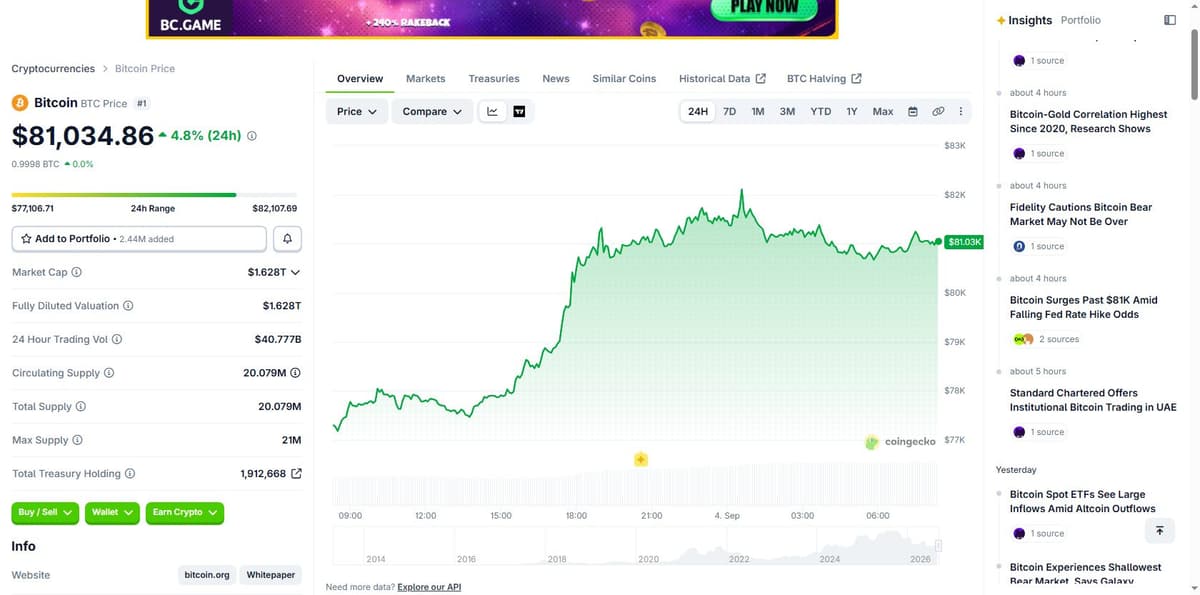
Bitcoin ripped from roughly $77,100 to above $82,100 in the space of a single trading session, a move that started quietly and then just kept going. The spark wasn’t a hack, an ETF headline, or some whale wallet moving coins. It was two sentences from a sitting Federal Reserve official.
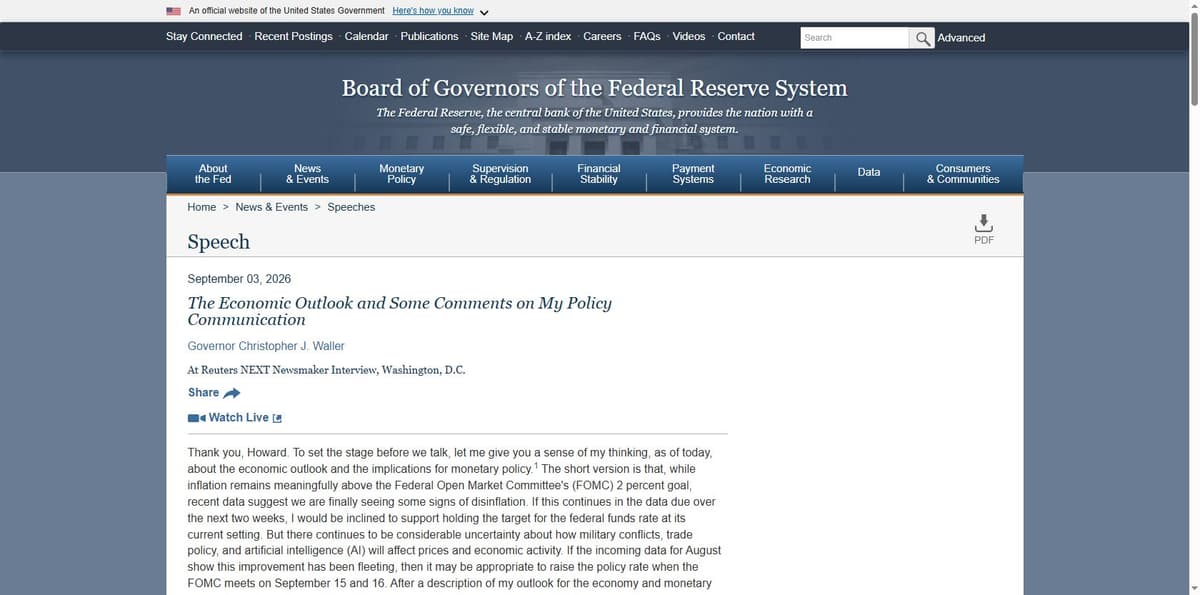
Governor Christopher Waller told a Reuters NEXT interview on September 3 that “recent data suggest we are finally seeing some signs of disinflation,” adding that if the trend holds through the next two weeks of data, he’d back holding the federal funds rate steady at the FOMC’s September 15-16 meeting. The full remarks are posted on the Federal Reserve’s own site. That’s about as close to a green light as risk assets get from a Fed governor these days.
Six days of dread, undone in one interview
Context matters here. Six days earlier, at the Jackson Hole symposium, Fed Chair Kevin Warsh had said the opposite. He called inflation “concerning,” said the central bank still had “work to do,” and left the door wide open to a rate hike instead of a cut. Odds of a September hike, priced by traders before that speech at roughly one in three, jumped past 50/50 afterward.
Crypto doesn’t like that setup. Higher-for-longer rates pull capital toward yield and away from anything volatile, and the market spent the following days grinding lower, dragging bitcoin down toward the high $70,000s. Waller’s comments flipped that script almost overnight.
Where the short squeeze actually shows up
The price chart alone tells part of the story. Bitcoin bounced hard off a zone just above $77,000, a level that had flipped from resistance to support earlier this year, and tore through $80,000 before topping out just past $82,100.
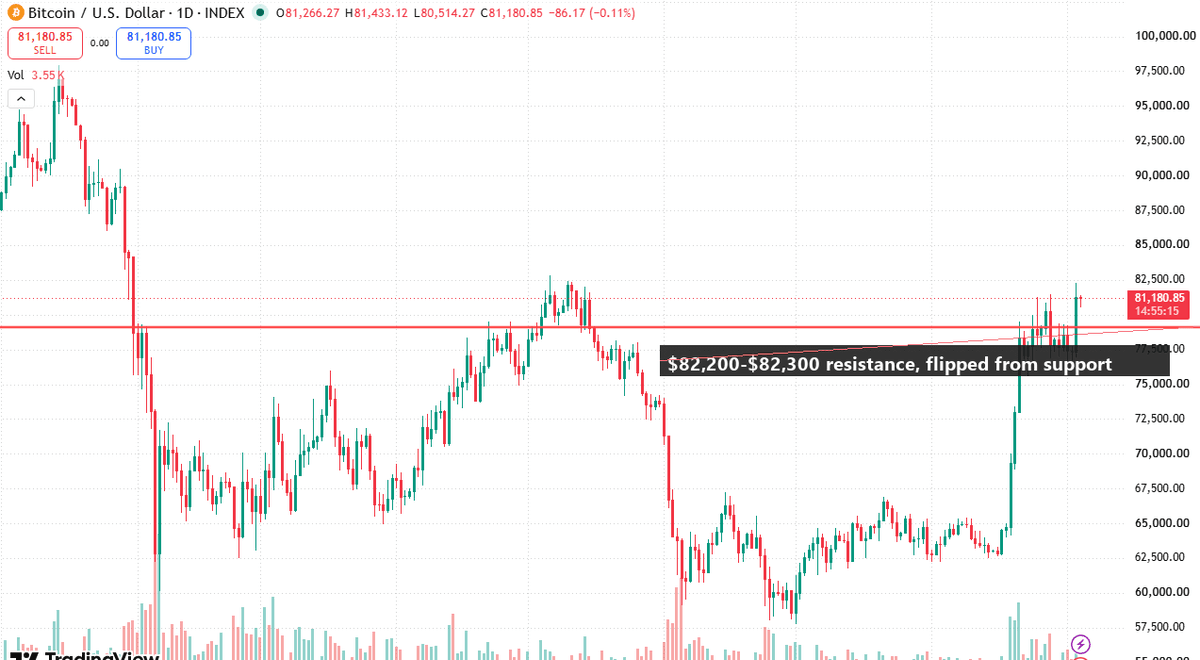
That “flipped from resistance to support” level isn’t eyeballed. It sits almost exactly at $82,200 to $82,300, a zone that rejected price earlier this year before this week’s rally. Bitcoin tapped it within roughly $100 on the nose, visible on the daily chart below with the zone marked.
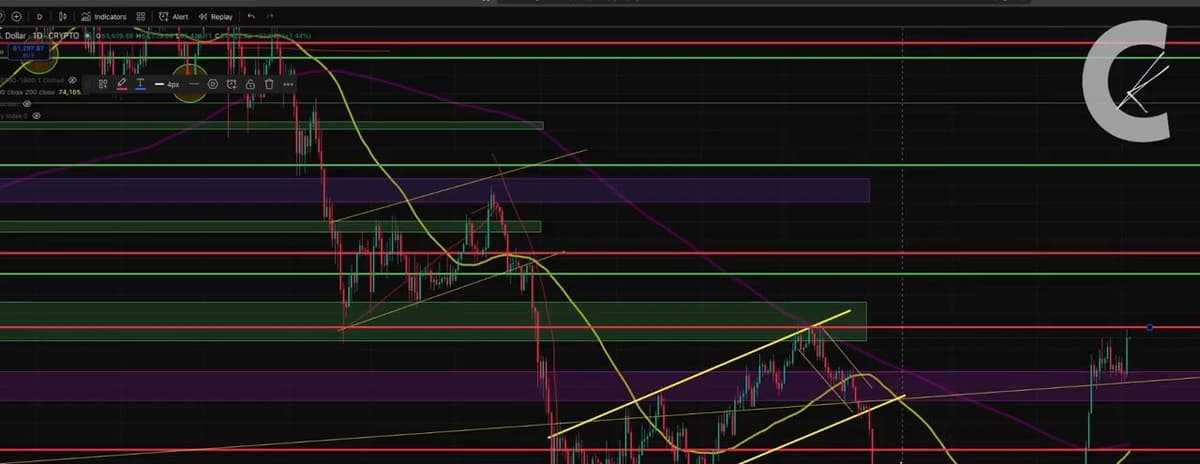
Zoom out to the full 2026 downtrend and the setup looks even less accidental. Price had been carving a descending channel since the early-year top, bouncing between a falling trendline on top and a rising one underneath, with a cluster of horizontal support/resistance bands stacked through the low $70,000s to high $80,000s.
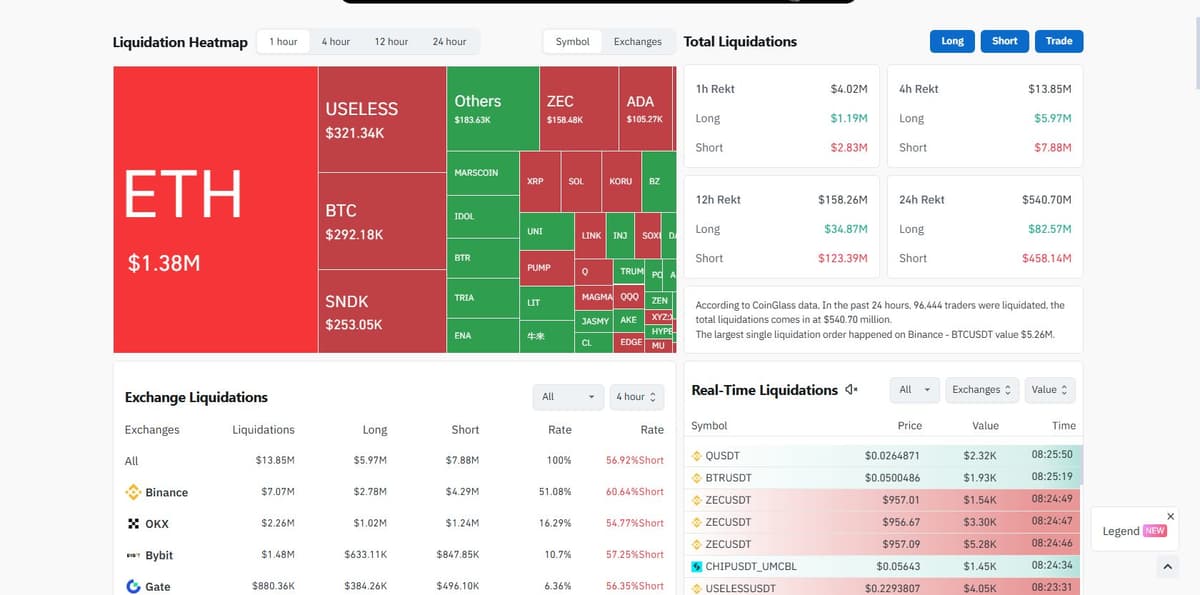
What actually amplified the move was positioning, not just the news itself. CoinGlass data shows $540.7 million in total liquidations across crypto derivatives in the trailing 24 hours, and the split is lopsided. Roughly $458 million of that came from short positions getting force-closed, against about $82.5 million on the long side, per CoinGlass’s live liquidation tracker.
Traders who’d bet on more downside got run over. Total open interest in bitcoin futures climbed nearly 9% over the same window, an odd thing to see on a day when shorts were getting wiped out, which suggests fresh money piled in on the way up rather than just existing shorts unwinding.
Funding rates never got extreme
One thing worth flagging, because it cuts against the “euphoria” framing some are already reaching for: funding rates on bitcoin perpetuals stayed mild through the move. The open-interest-weighted funding rate sat at just 0.0057% at last check, nowhere near the kind of overheated levels that usually precede a sharp reversal.
That’s a fairly calm number for a day that added tens of billions to the total crypto market. Whether that calm holds is the real question heading into the August inflation print Waller flagged as his own trigger.
Strategy’s bitcoin pile swings back to a real profit
The move also dragged Strategy, the Michael Saylor-chaired company sitting on the largest corporate bitcoin stash anywhere, back into the green. The firm holds 845,050 BTC bought at an average cost of $76,052 each. At bitcoin’s current price, that position is worth $68.39 billion against a $64.27 billion cost basis, an unrealized gain of about $4.12 billion.
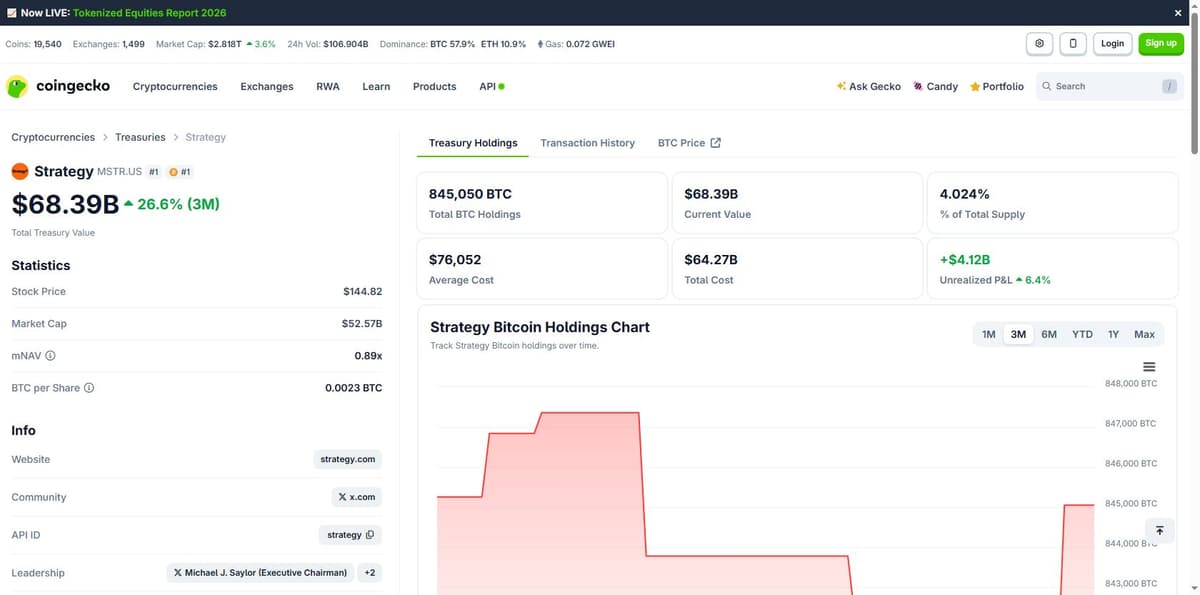
Back in July, with bitcoin down near $58,000, that same position was sitting more than $13 billion underwater. A matter of weeks, and the math flipped completely. That’s the kind of swing that makes corporate treasury bitcoin bets look either brilliant or reckless depending entirely on which week someone checks the balance sheet.
It wasn’t just bitcoin
Ether climbed just over 5% to trade near $2,510. XRP outpaced everything in the majors, up more than 6.5% on the day. Solana added a more modest 3.3%. The move had breadth, not just a single asset getting squeezed in isolation, and total crypto market capitalization pushed to $2.818 trillion, up 3.6% in 24 hours.
Bitcoin dominance held near 58%, so the rally wasn’t really an “altcoin season” story. It was a macro-driven, bitcoin-led move that dragged the rest of the market up with it, the way these things usually work when the catalyst is a Fed official rather than sector-specific news.
Sentiment flipped just as fast as price did
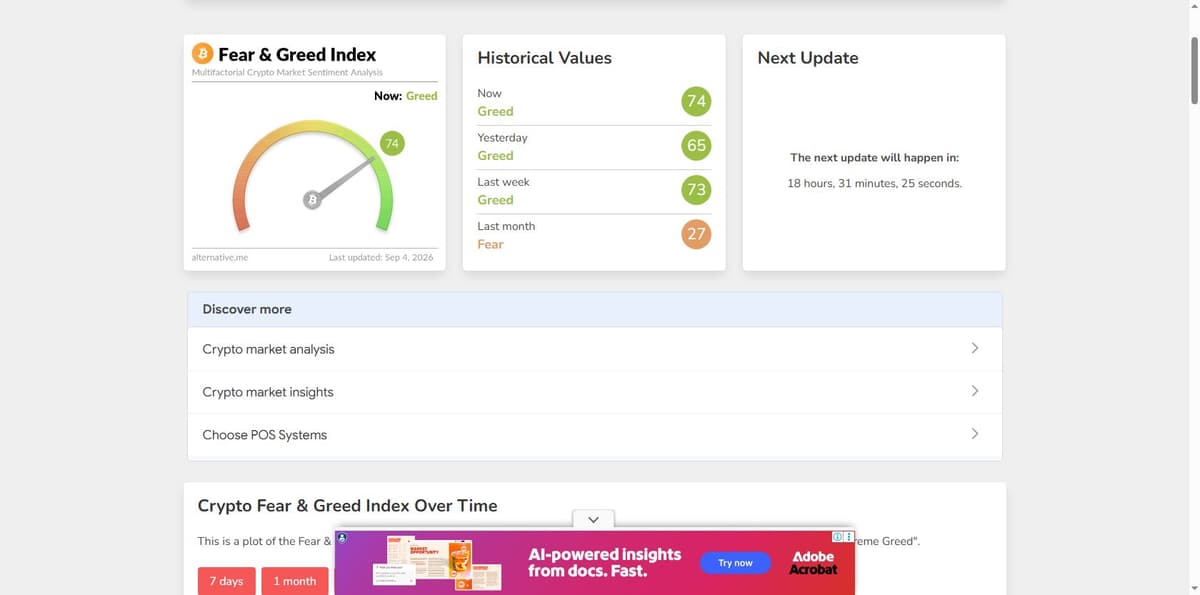
The Crypto Fear and Greed Index read 74, squarely in Greed territory, as of September 4. A month ago the same gauge sat at 27, deep in Fear. That’s a genuinely fast round trip in sentiment, and it lines up with a market that spent late August bracing for a hike and then got handed the opposite instead.
None of this settles anything for good. Waller himself was explicit that his position depends on the August data still due before the September 15-16 meeting, and Warsh’s more hawkish read hasn’t gone anywhere. The rally bought the market two weeks of relief, not a resolved rate path, and the next data print is what decides whether the shorts that just got squeezed were early or simply wrong.