Ethereum spent nearly two weeks going almost nowhere after breaking out of a downtrend that had run for roughly a year. That kind of stall usually spooks a market. This time, the stall itself was the signal, and it just resolved higher.
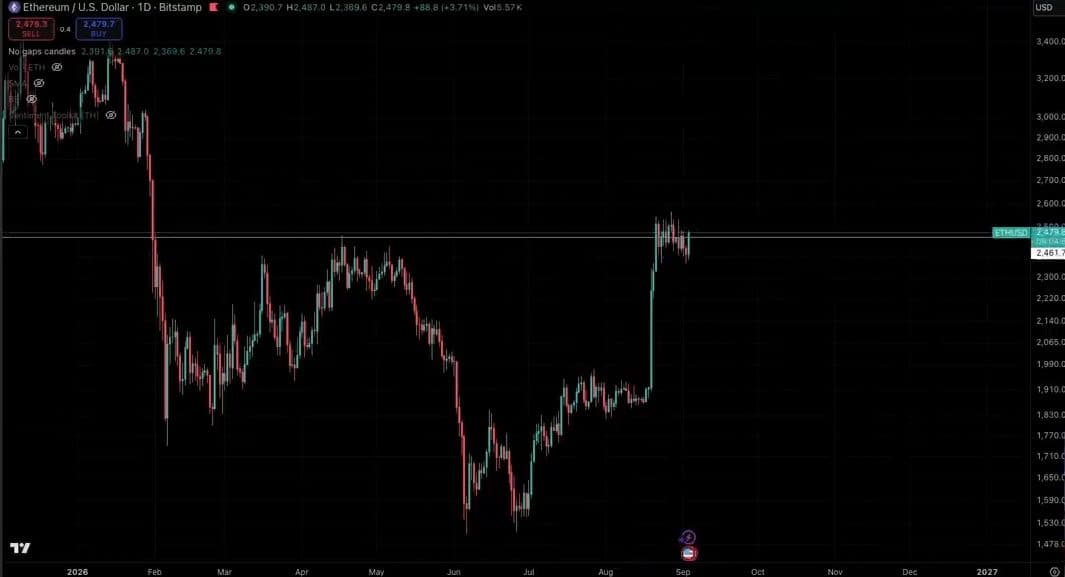
The breakout happened in late August, when ETH cleared a descending trendline it had been trapped under since the bear market began. What followed wasn’t a straight shot higher. Price parked itself in a tight band around $2,450 to $2,490 and mostly sat there.
Why going nowhere was actually the good outcome
A breakout that immediately reverses is a bad sign. A breakout that immediately rockets higher without pausing is also a bad sign, since it usually means leveraged longs are piling in fast and setting up the next flush. Sideways, boring, unglamorous consolidation is the outcome that lets a market actually digest a move.
CoinGlass data backs this up directly. Ethereum futures show $114.6 million in liquidations over the trailing 24 hours, and short positions took the overwhelming majority of that, $92.55 million versus just $22.05 million on the long side.
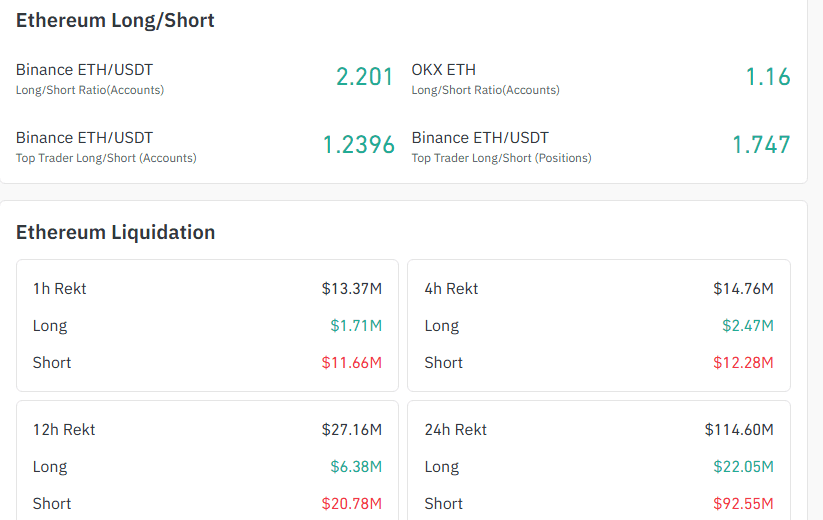
That pattern, shorts absorbing the damage while longs keep getting paid, has been the theme since the breakout, not a one-day fluke. Traders betting against the move keep getting run over, and that’s exactly the kind of price action that keeps a rally structurally sound instead of purely sentiment-driven.
The pattern on the chart itself
Zoomed into the consolidation, the price action traces a narrow descending wedge sitting right on top of the breakout level, the kind of pattern that typically resolves in the direction of the larger trend it’s attached to. It’s a small, almost boring formation. Boring is the point.
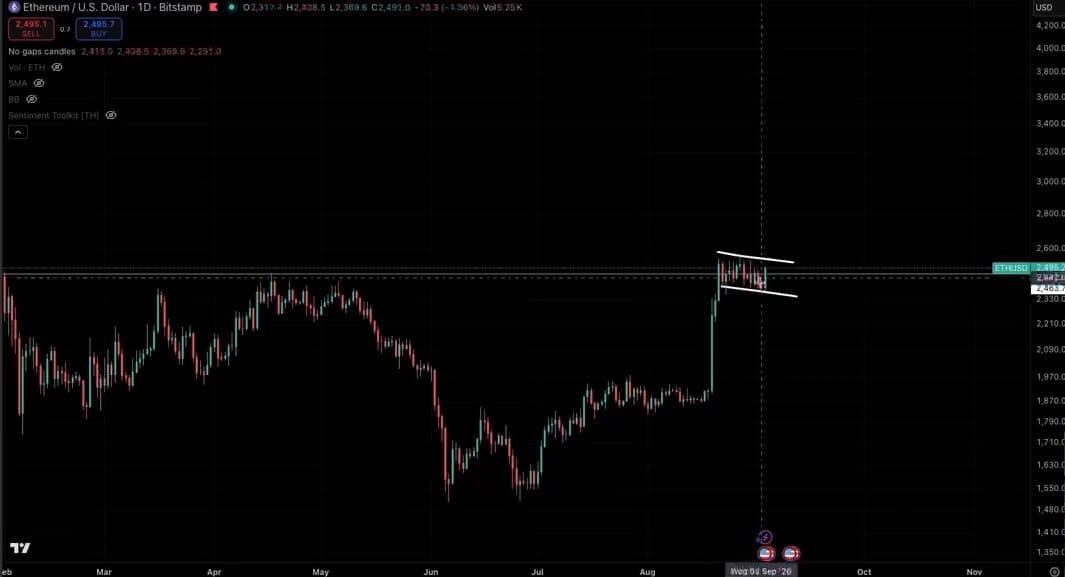
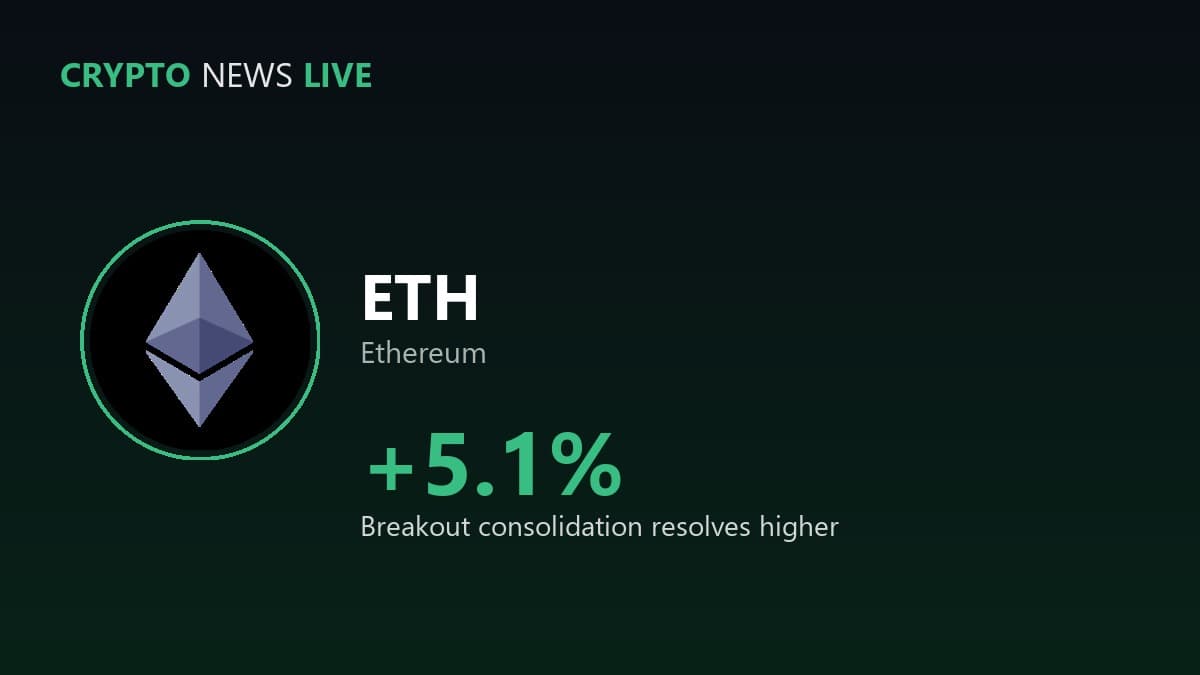
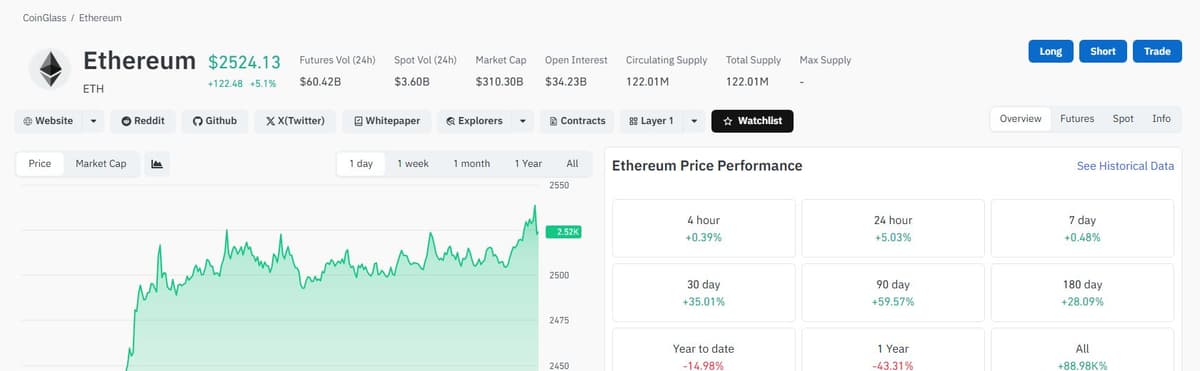
As of this writing, that wedge has resolved. ETH trades at $2,524, up 5.1% in the past 24 hours, part of the same broad crypto rally covered separately on CryptoNewsLive today following dovish Federal Reserve commentary. The 90-day return now sits at 59.57%, and the 30-day return is 35.01%.
Institutional flows lined up the same way
Spot Ethereum ETFs pulled in $141.4 million in net inflows on September 3, reversing a $48.2 million outflow the day before, according to Farside Investors’ own daily flow tracker. That’s real allocator money agreeing with what the derivatives data already implied.
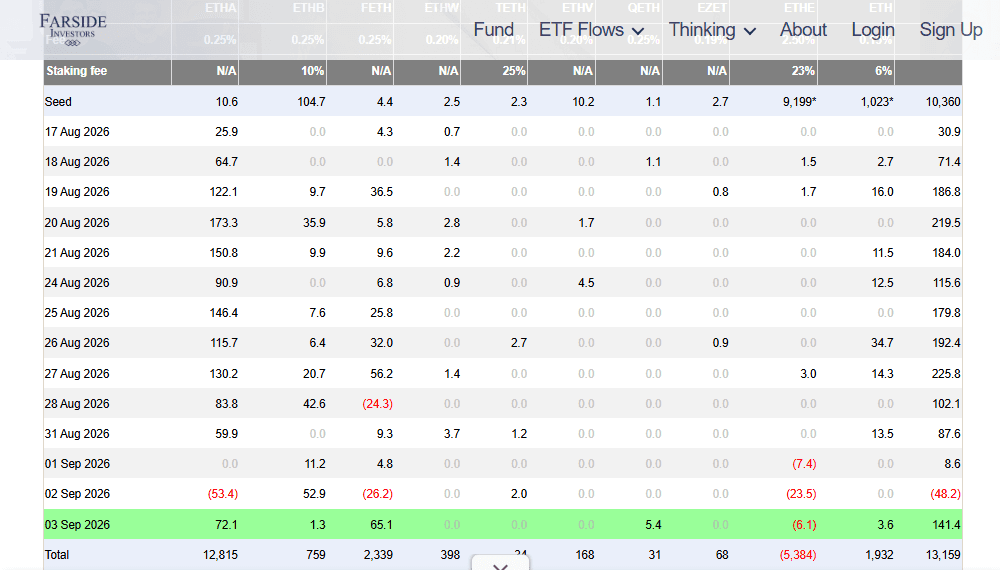
It wasn’t a one-way street even in that same stretch. The 2nd of September alone saw money leave the funds before it came back the very next day. Flows this size aren’t dramatic in isolation, but the reversal direction matters more than the size does here.
Still underwater for the year, worth remembering
None of this erases the bigger picture. Ethereum is still down 14.98% year to date and down 43.31% over the past twelve months, per CoinGlass’s own performance breakdown. A strong two-month stretch doesn’t undo a brutal bear market on its own.
September has a reputation as one of the weaker months for risk assets historically, and that reputation exists whether or not it plays out this particular year. The breakout, the consolidation, and now the resolution higher are real and independently verifiable. Whether they turn into a durable trend instead of another lower high is the part nobody gets to know in advance.