Solana is sitting at $100.32, almost exactly where its last real bounce started. Whether it holds decides the next month.
A Zone That’s Already Done This Twice
SOL spent most of July and August boxed between $72 and $84, going nowhere in particular. Then it broke out hard on August 20, ran through $97, stalled, pushed again, and finally cleared $110 by August 27, a rally of roughly 45% off the base. That $97 to $100 band wasn’t random. It’s the exact shelf SOL consolidated on twice during the breakout itself, first as resistance, then flipped as support once price cleared it.
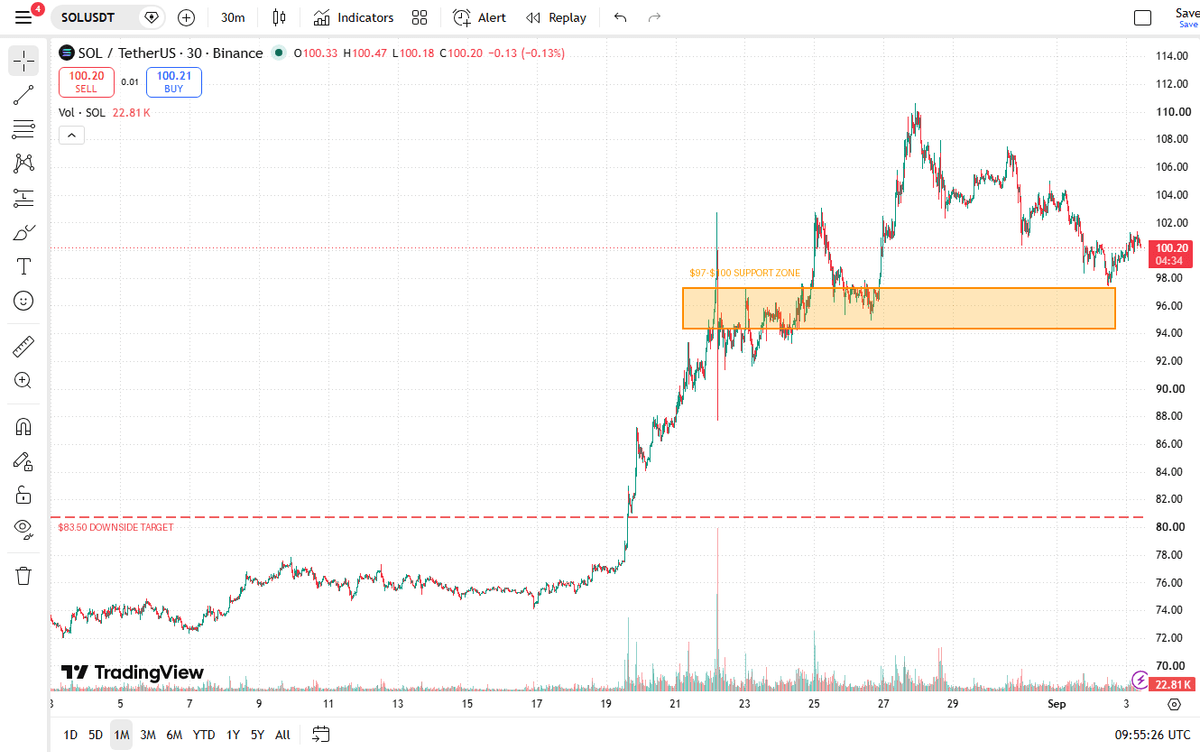
SOL has since pulled back from that $110 high, and it’s now retesting the same $97 to $100 shelf from above. A level that flips from resistance to support twice tends to matter to chart watchers a third time too, though that’s a pattern, not a guarantee.
The Money That Kept Showing Up Anyway
Here’s the part that doesn’t fit a simple “price is weak” read: US spot Solana ETFs have pulled in $1.34 billion in cumulative net inflows, with $1.38 billion in total net assets now sitting in these funds, according to SoSoValue’s own ETF flow tracker. Bitwise’s BSOL alone accounts for just over $1 billion of that, the largest Solana ETF by assets.
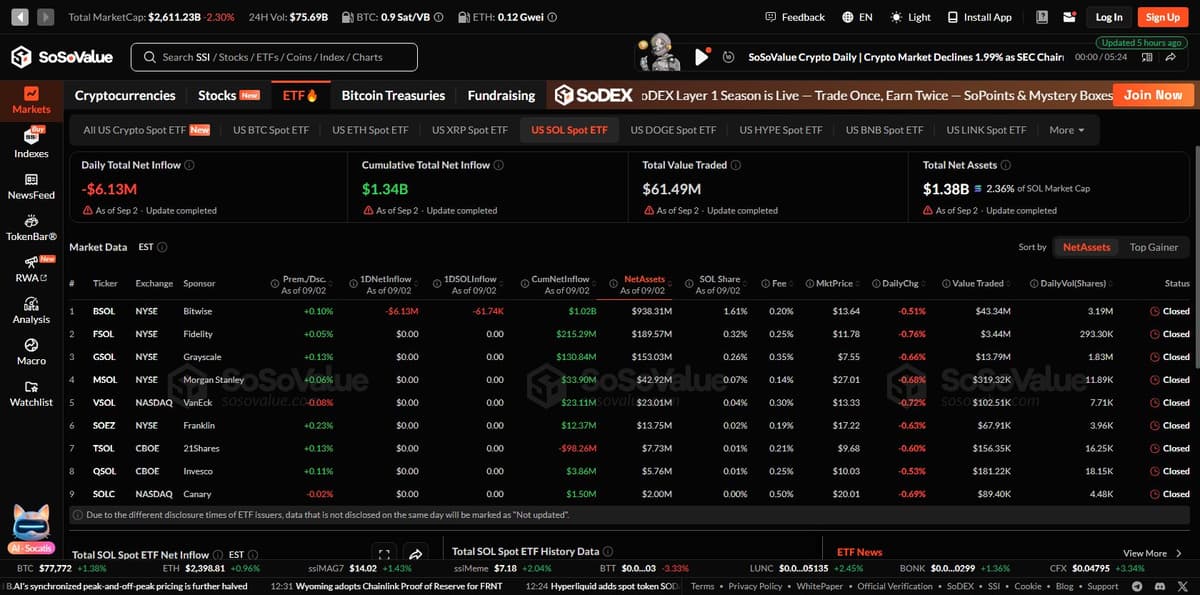
Daily flow did dip slightly, negative $6.13 million as of September 2, so this isn’t a straight line up. But a fund category holding onto $1.38 billion, over 2% of SOL’s entire market cap, while the token itself round-trips back to a support shelf is a real divergence. Institutions built the position during the rally and mostly haven’t unwound it during the pullback.
Positioning Isn’t Crowded Either Way
Derivatives traders aren’t leaning hard in either direction right now. SOL’s long/short ratio sits close to even, and open interest holds around $6.38 billion, per Coinglass’s live futures data. That matters because a lopsided positioning read (crowded longs, say) would make a break of the $97 zone far more violent, a cascade of forced liquidations on top of the technical break. Right now, there’s no obvious fuel for that kind of move in either direction. SOL is still up 36.54% over 30 days and 46% over 90, even after the pullback, so the broader trend hasn’t actually reversed.
What Happens From Here
If buyers step in at the $97 to $100 shelf the way they did the last two times, the same structure that produced the run to $110 argues for another leg toward $117 to $122, the next real resistance shelf above the recent high.
If SOL melts through $97 instead, and the ETF flow data above suggests institutions aren’t positioned for that outcome, the next real liquidity pocket sits back around $83.50, the top of the old July-August base.
Neither outcome is decided yet. The next day or two of price action against this exact shelf is the tell.