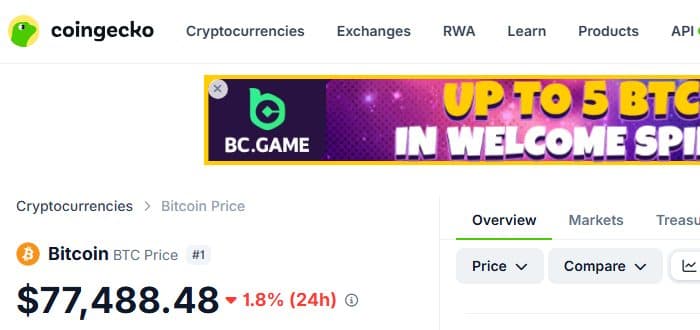
$BTC is back at the one price shelf that has decided almost everything about this market since mid-August. Bitcoin is trading around $77,488 right now, down 1.8% over the past day, sitting squarely inside the $72,000 to $77,000 band that traders have been calling the golden Fibonacci pocket for weeks.
That zone matters because of what came before it. Bitcoin bottomed near $62,843 on August 17, then ripped to a local high of $80,268 by August 28, according to CoinGecko’s own price history. The current pullback has brought price straight back down into the exact range that marked the middle of that move.
The Zone Nobody’s Escaped Yet
Hold this shelf as support, and the setup gets interesting fast. A clean bounce off $72,000 keeps the door open toward $82,000 and beyond, a fresh high above the late-August peak.
Lose it, though, and the story flips. Below $72,000 sits a genuine air pocket. CoinGecko’s data shows Bitcoin spent August 15 through 19 consolidating between roughly $62,843 and $64,686 before the breakout even started, meaning a real retest of $63,000 to $67,000 isn’t some random target pulled from nowhere. It’s revisiting ground the market already sat on for days.
A $20,000 Swing Either Way
Stack the two outcomes together and the range on the table is close to $20,000 wide, from a possible push past $82,000 down to a slide toward $63,000. Whichever way this resolves won’t stay contained to Bitcoin alone. Altcoins have leaned on BTC’s direction all year, and a move this size tends to drag the rest of the market with it.
The Positioning Picture Looks Less Lopsided Today
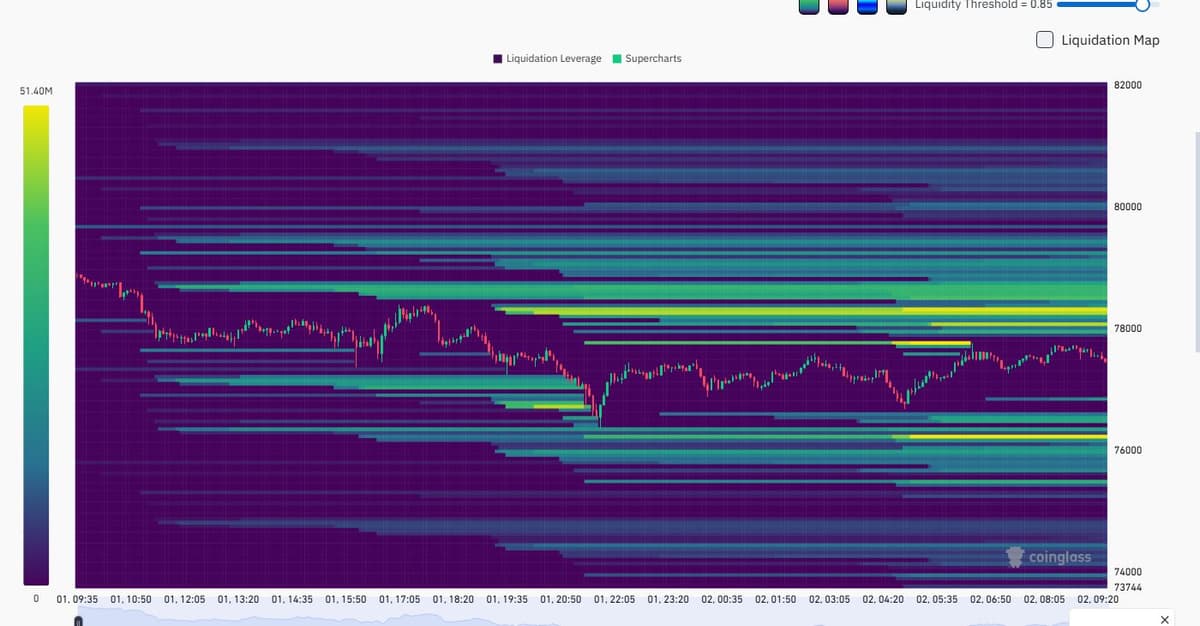
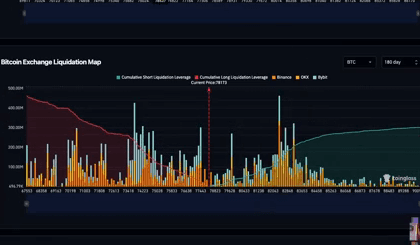
Derivatives data adds some texture to the standoff. Coinglass’s own liquidation heatmap shows estimated liquidation clusters sitting on both sides of current price, not stacked overwhelmingly on one side, with dense bands both just above $78,000 and down near $76,000.
Today’s aggregate numbers back that up. Coinglass logged $339.15 million in 24-hour liquidations market-wide, up 129% from the prior day, against a long/short split of 48.56% to 51.44%, about as close to even as that ratio gets. Open interest sits at $136.68 billion, a small dip of 0.62%.
A near-even long/short split isn’t nothing. Two weeks ago, when Bitcoin was still ripping from $62,000 toward $80,000, positioning skewed heavily toward one side, the kind of imbalance that tends to snap violently once price stalls out. A more balanced book right now means less fuel sitting on either side for a sudden, forced cascade.
Why $83,000 Is the Number That Actually Matters
None of this confirms a bottom is in. By strict market-structure logic, that only happens once Bitcoin prints a fresh higher high above the late-August peak near $80,268, realistically somewhere past $83,000 to count as a clean break. Until then, the broader trend since the summer high is still technically a downtrend, golden zone bounce or not.
What’s changed is the tail risk. A capitulation-style flush, the kind that erases 10% to 20% in a matter of hours, needs one-sided crowding to feed on. Right now, per Coinglass’s own numbers, that fuel looks a lot thinner than it did during the run to $80,000.
Whether $72,000 holds or breaks over the coming days will say a lot about where Bitcoin heads into the rest of September. For now, the market is parked right on top of the line, waiting.