A $30,000 Spread, One Chart
$BTC is sitting right on top of a real decision zone this week, and three separate things converging on the same five days are going to decide which way it breaks. Not one catalyst. Three, stacked on top of each other.
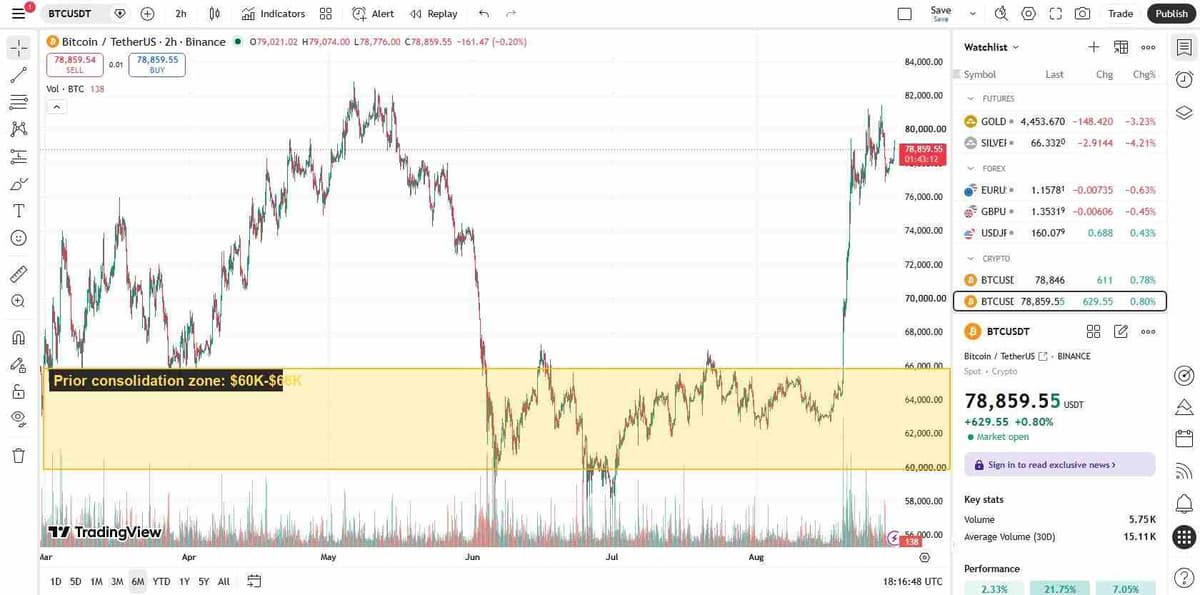
The chart itself tells the story better than any headline can. Price rallied from the low $60,000s in late July back up toward $79,000, and it’s now testing a resistance band that’s held twice before without a clean break.
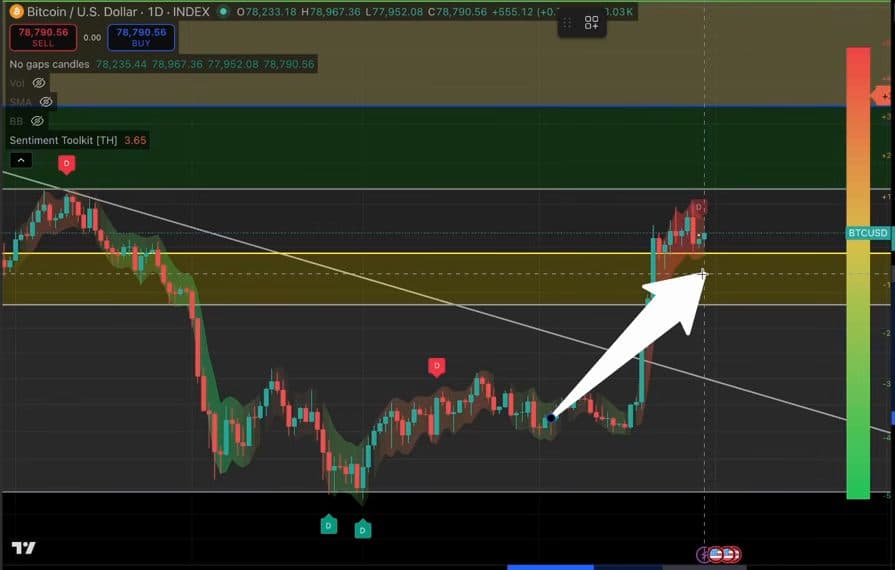
Hold that band and $BTC has room to run toward the $83,000 to $91,000 area, the next real supply zone above. Lose it and the chart points back down toward the $60,000 to $66,000 range it spent most of June and July building.
Why Friday Matters More Than Usual
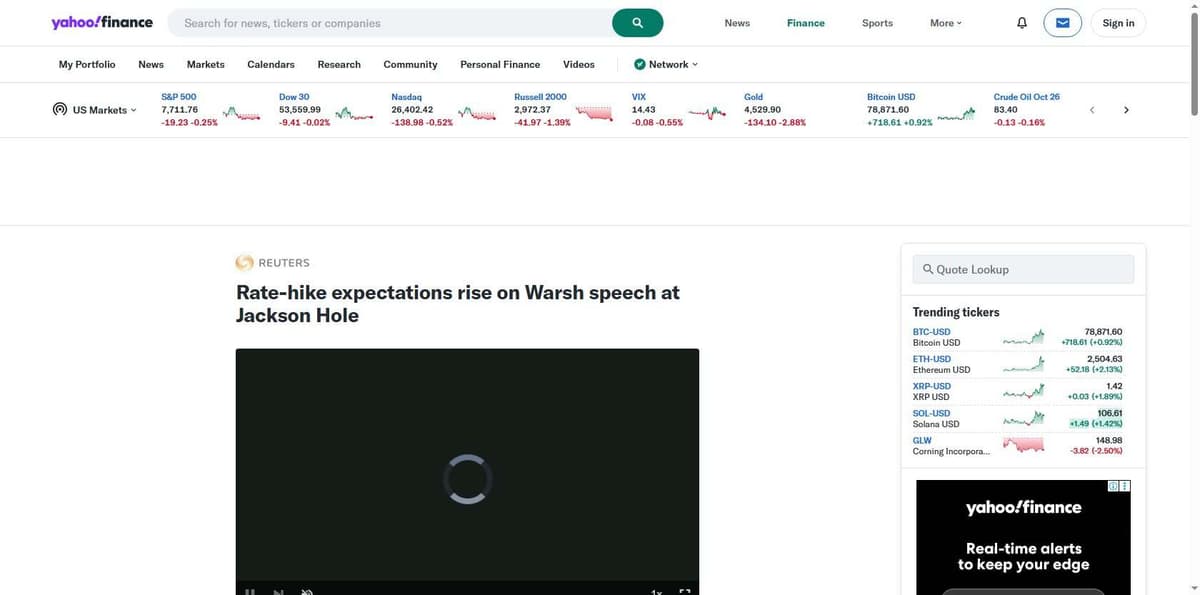
US non-farm payrolls land Friday, and this isn’t a routine monthly print this time. Fed Chair Kevin Warsh’s Jackson Hole speech last Friday already jolted rate-hike expectations. The rates market went from pricing a 35% chance of a hike at the Fed’s September 16 meeting to a 60% chance within hours of Warsh’s remarks, according to Reuters, citing CME data.
A weak jobs number gives the Fed room to hold. A strong one, or a soft downward revision to a prior month that gets overlooked in the headline read, pushes those odds higher still. Either way, crypto is not disconnected from this the way some traders like to pretend. Institutions became the marginal buyer of Bitcoin a while back, and institutions go risk-off together when rate expectations shift, selling whatever’s liquid. That includes $BTC.
The Venezuela Deal Nobody’s Pricing In Right
Buried under the jobs-data headlines is a second lever pointed at the same target. President Trump announced Friday what he called the biggest oil deal in history, a 100-year concession giving a US-aligned joint venture roughly 55% control over 65 billion barrels of Venezuelan oil reserves, according to reporting from the Associated Press.

On the surface this is about gas prices. Underneath, it’s aimed at something bigger: long-term bond yields. More oil supply, in theory, cools inflation expectations. Cooler inflation expectations mean less pressure on the 20-year and 30-year Treasury yields that have been climbing all year on fears the US can’t manage its own debt.
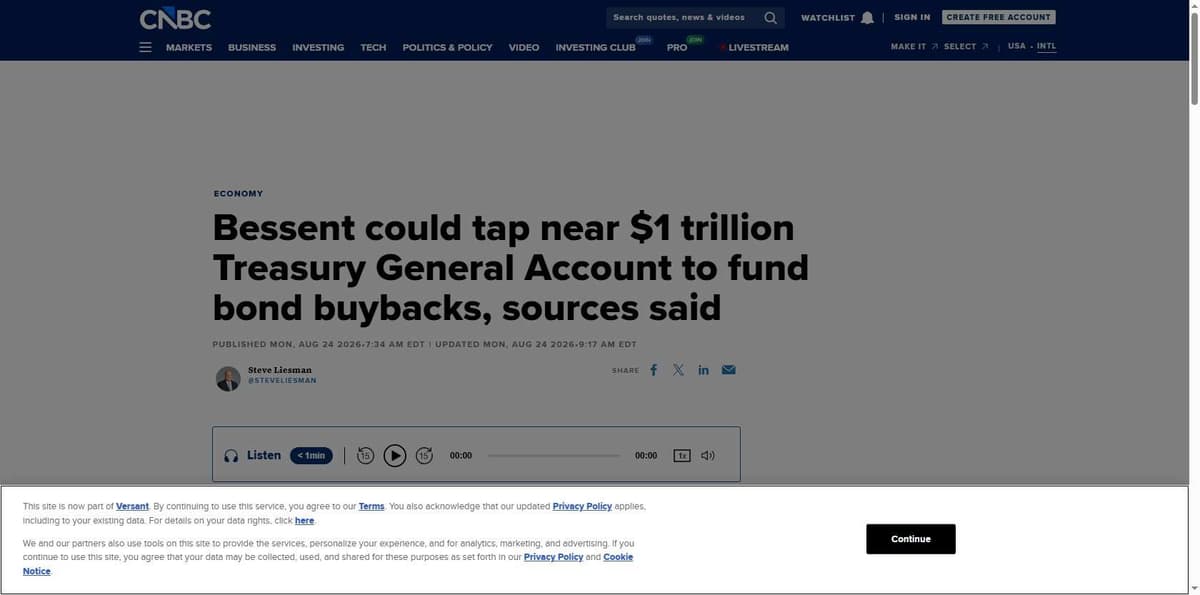
That’s not a stretch reading. It lines up directly with what Treasury Secretary Scott Bessent has been doing for weeks. Treasury doubled the size of its long-end bond buybacks from $2 billion to $4 billion per operation in late August, and Bessent has reportedly built up the Treasury General Account to nearly $1 trillion, giving him room to go bigger still, per CNBC’s reporting.
Three different moves, one government, one goal. Bond buybacks, a sanctions push aimed at Iran-linked oil flows, and now the Venezuela deal all point at the same yield curve. Whether it actually works by Friday is a separate question. The intent isn’t subtle.
What Actually Ties Back to Bitcoin
None of this resolves cleanly in five days. Jobs data trickles in most of the week, not just Friday, with ISM and JOLTS Tuesday, ADP Wednesday, and jobless claims Thursday ahead of the main event. Each one nudges the rate-hike odds a little before the big number lands.
$BTC’s setup makes this week higher stakes than a normal one. A hold above the current resistance zone on real volume argues the broader uptrend from the summer low is still intact. A clean break back below it, especially timed to a hot jobs print or a further leg up in yields, opens the door back toward the low $60,000s. The macro data and the chart are, for once, watching the exact same week.