Bitcoin traded at $85,075 on Monday, up 4.8% on the day and running through a price band that had turned the last four rally attempts back since June. The last time price cleared this zone cleanly, it was rejected within days.
This time the move landed in the middle of the busiest single week for macro and crypto-specific policy news since the spring. Four separate government actions from three different bodies hit inside five days, and Bitcoin’s chart is now sitting on the other side of all of them.
The Ceiling That Held Since May
The daily chart shows why today’s candle matters. Bitcoin peaked near $126,000 in November, then spent the winter grinding lower into a low-$60,000s floor by July.
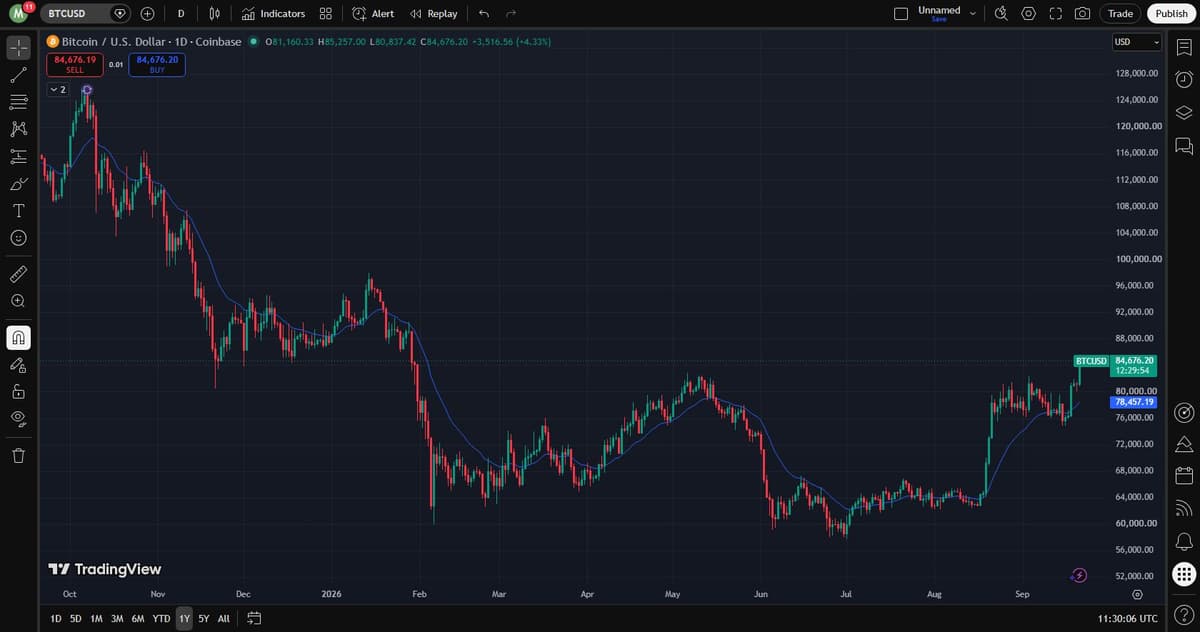
From there, a recovery leg carried price back up near $92,000-$96,000 in May before sellers took it apart again. The summer low near $58,000 in July was followed by a slow climb into a tight $76,000-$81,000 band that held through August and most of September, rejected on at least four separate visits.
Today’s candle didn’t just poke above that band. It ran to an intraday high above $85,200, clearing the entire range in one session on volume that stands out against the chop of the prior six weeks.
The Base Underneath the Ceiling Is a Double Bottom
Zoom out on the same chart and the ceiling isn’t the whole story. The price action underneath it has its own shape: a low near $58,000-$60,000 in June, a partial bounce that stalled around $67,000, then a second test of that same low zone in July before the real recovery began.
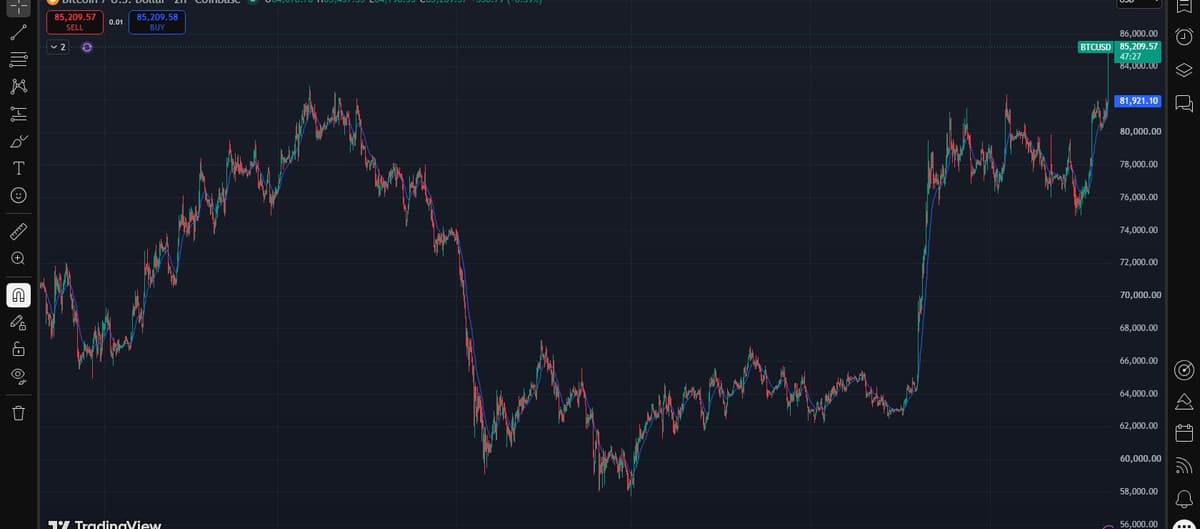
That’s a textbook double bottom, not just a flat range that happened to break. The second low held roughly where the first one did, buyers defended it, and the move off that base has been the strongest stretch since the November top. A resistance break with a base like that underneath it carries more technical weight than a breakout with no structure behind it.
Four Government Actions in Five Days
The move didn’t happen in a vacuum. Start with the Senate. On September 15, a procedural cloture vote on the Digital Asset Market CLARITY Act fell short 50-49, well below the 60 votes needed to advance the bill.
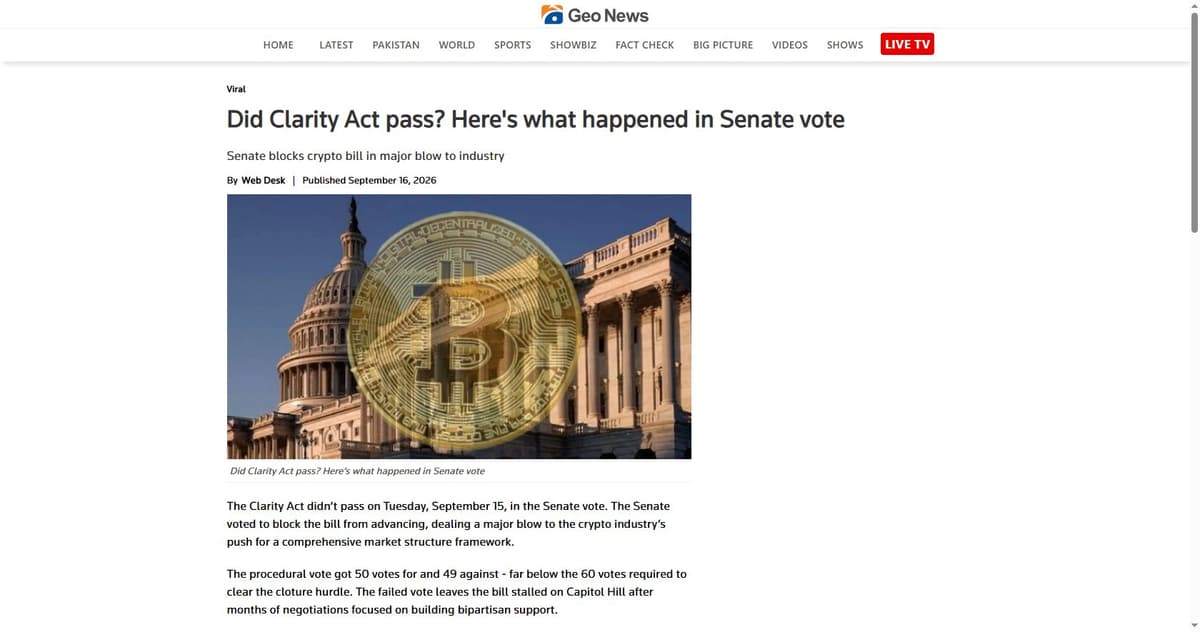
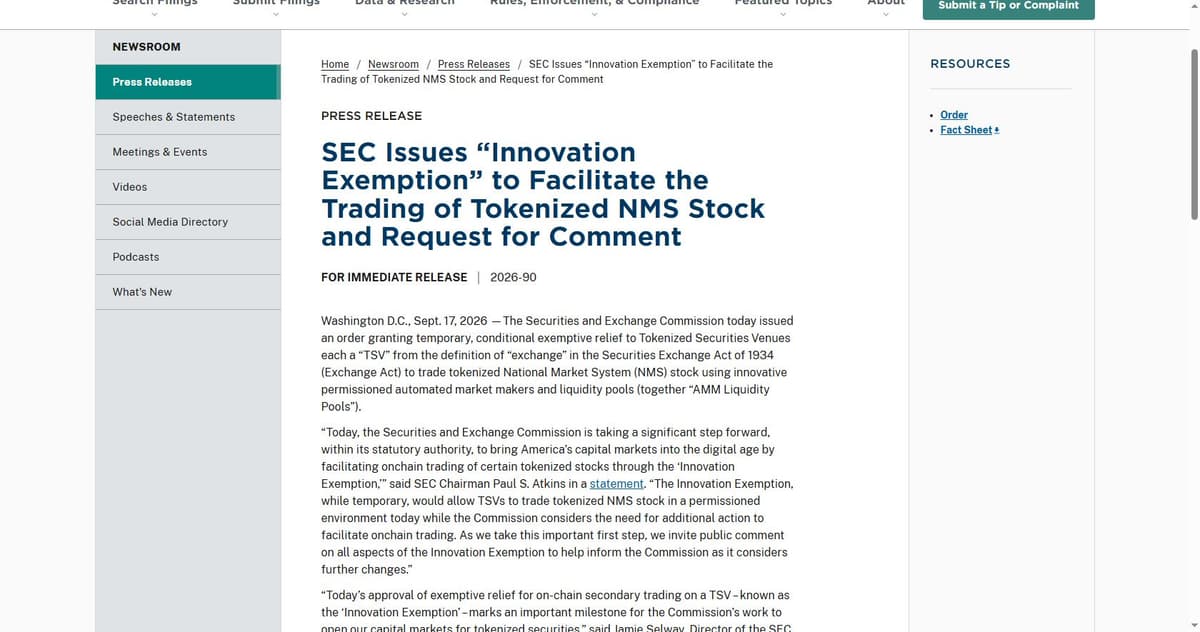
The market’s read going in was that a stalled bill meant a stalled framework. That read didn’t survive 48 hours. On September 17, the SEC issued what it called an “Innovation Exemption,” granting Tokenized Securities Venues temporary, conditional relief from the legal definition of an exchange so they can trade tokenized National Market System stock.
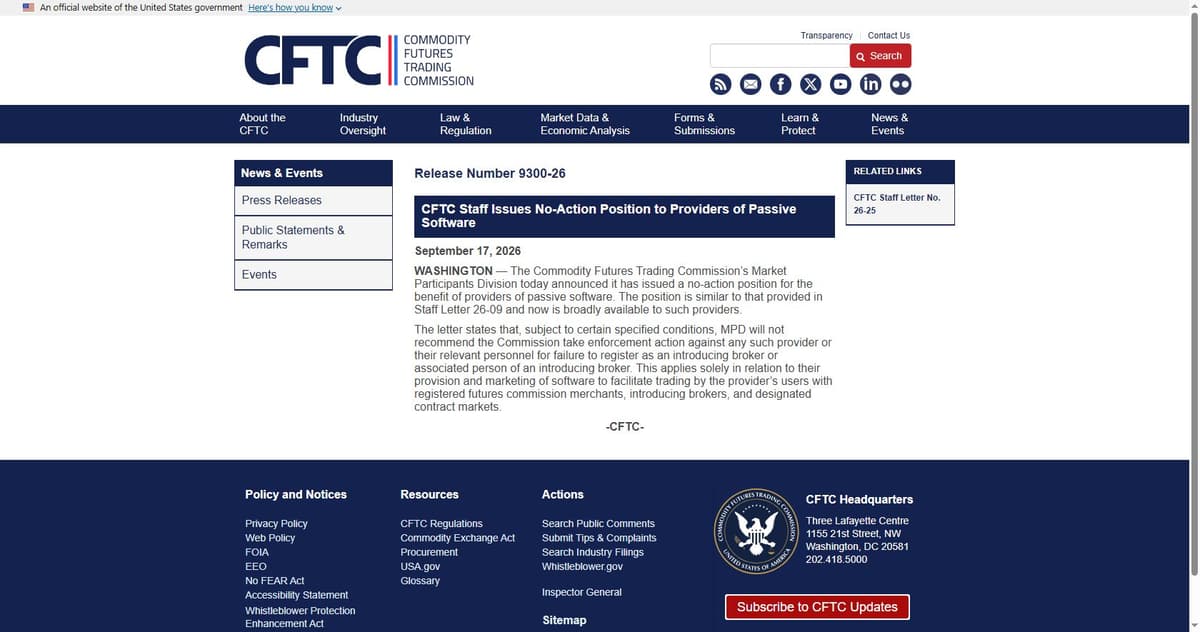
The same day, the CFTC’s Market Participants Division issued its own no-action position, telling providers of passive trading software they won’t face enforcement for failing to register as introducing brokers, so long as specific conditions are met.
Read together, the sequence is a regulator’s answer to a Congress that couldn’t get a bill past its own chamber: if the legislature won’t write the rules, the agencies will write their own. The market’s response was to stop pricing in a policy vacuum.
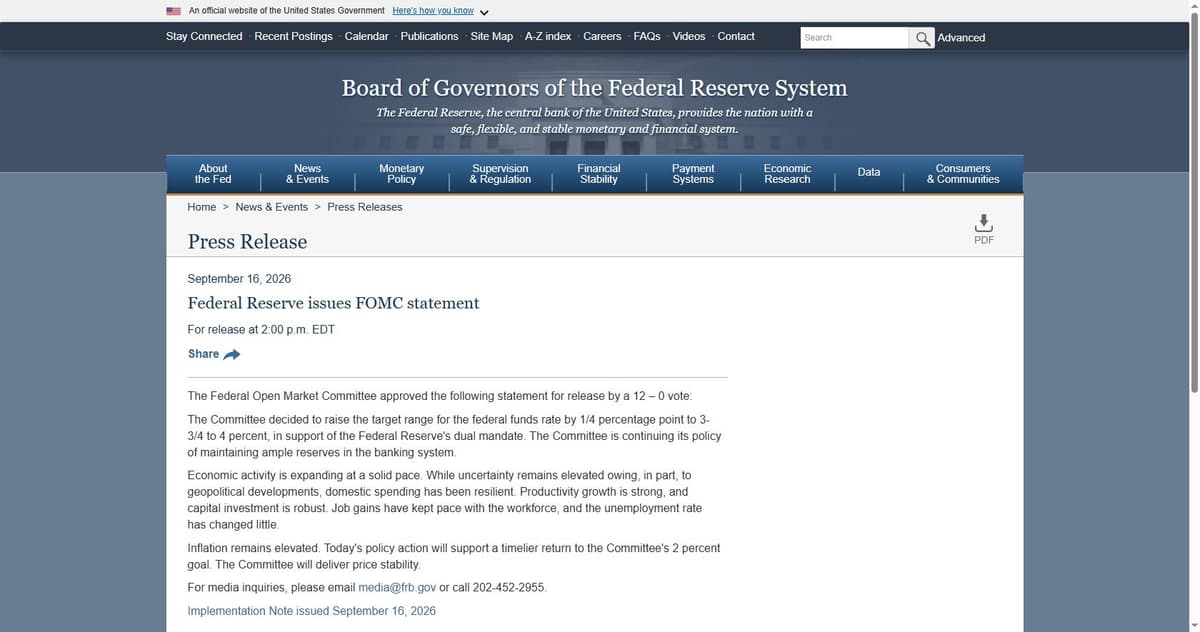
Layer the interest-rate decisions on top. The Federal Reserve raised its target range a quarter point to 3.75%-4% on September 16, its first hike since a hold-cycle stretching back to July 2023, passed by a 12-0 vote.
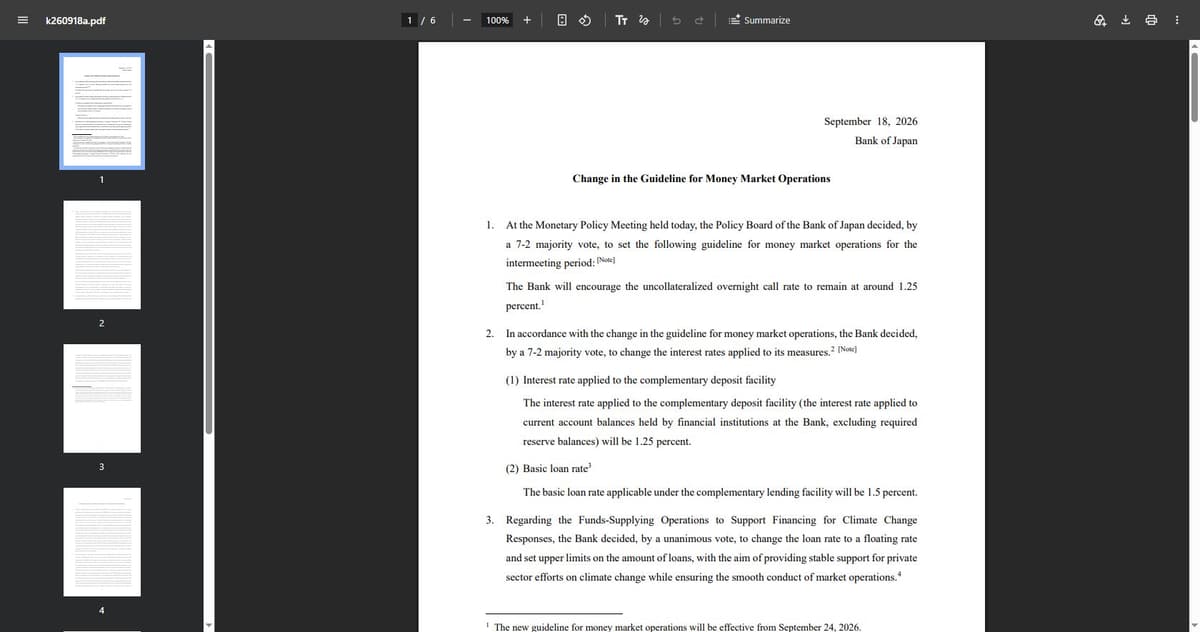
Two days earlier, the Bank of Japan moved for the first time in 31 years, lifting its policy rate a quarter point to 1.25% by a 7-2 vote, effective September 24.
Two central bank hikes and two federal agency actions, inside one working week, and Bitcoin came out the other side higher, not lower.
Strategy Keeps Buying, and Fidelity’s Own Macro Strategist Is Calling a New Cycle
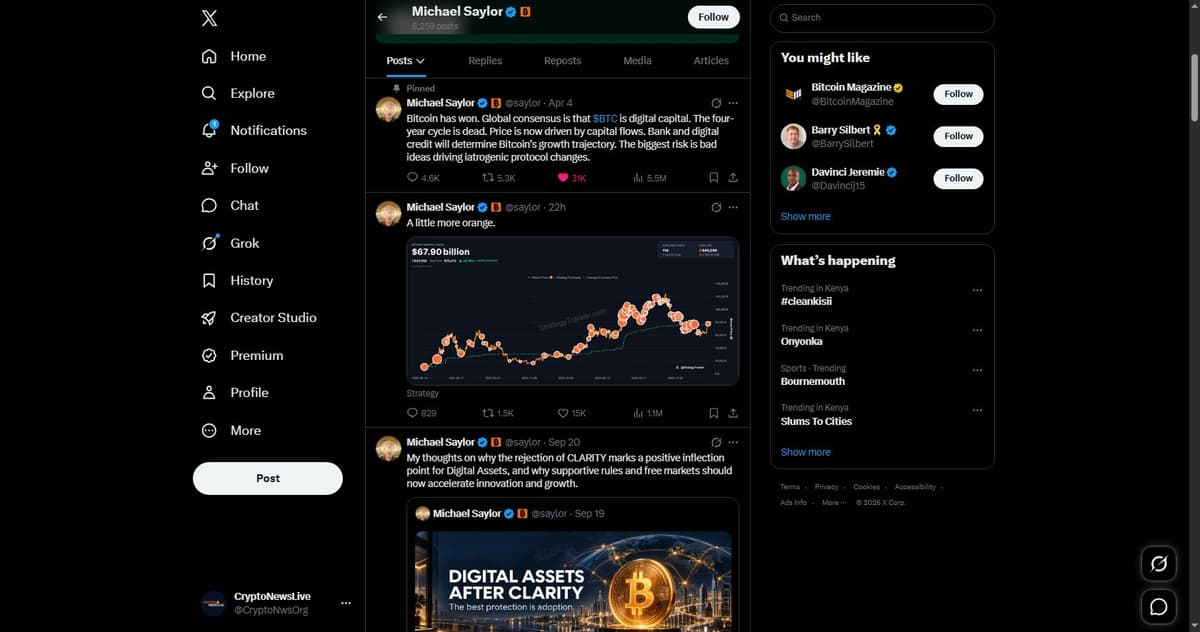
Strategy added to its position again. The company’s own tracker shows total reserve value at $67.90 billion against 845,090 BTC held, an accumulation chart that keeps climbing through every dip and every rally alike.
Fidelity’s own read has shifted too. Jurrien Timmer, Fidelity’s director of global macro, posted on September 19 that Bitcoin holding its $60,000 support zone for close to a year looks like a completed winter, and that he’s “sensing a new 4-year cycle bull market is underway,” pointing to the Bitcoin-to-gold ratio’s Z-score turning positive after bottoming near -100%.
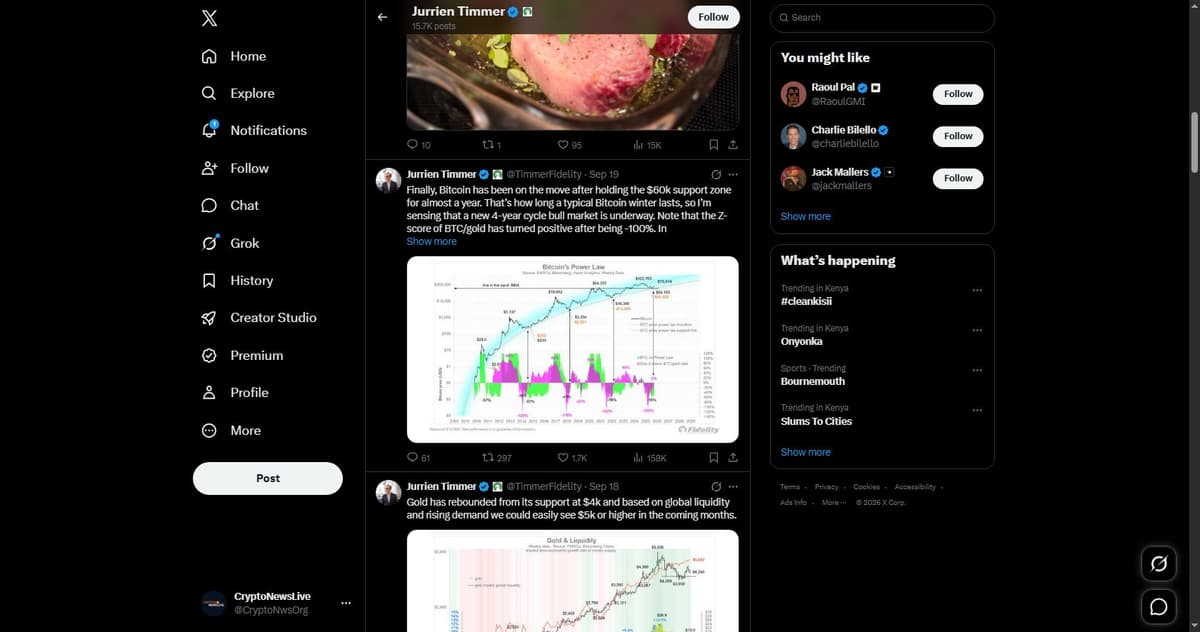
That’s a real shift in tone from a firm that was flagging bear-market risk as recently as three weeks earlier. It’s not a guarantee. It is a large institutional desk changing its public framing right as price broke a six-month ceiling.
The Short Squeeze Underneath the Rally
CoinGlass data shows the mechanics of today’s move. Open interest across the market sits at $155.5 billion, up almost 8% on the day, while total 24-hour liquidations reached $744.4 million.
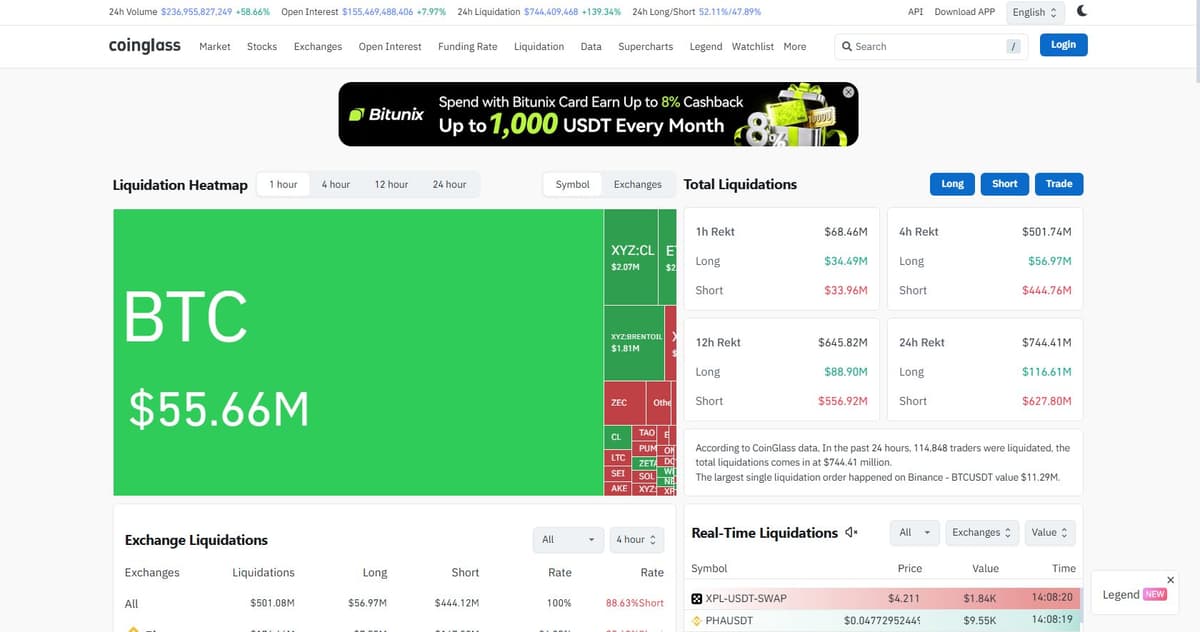
Of that total, $627.8 million, roughly 84%, came from short positions getting forced out. That’s a classic squeeze signature: traders positioned for the range to hold got run over once it didn’t, and their forced buybacks added fuel on the way up.
Sentiment Is Already Back at Greed
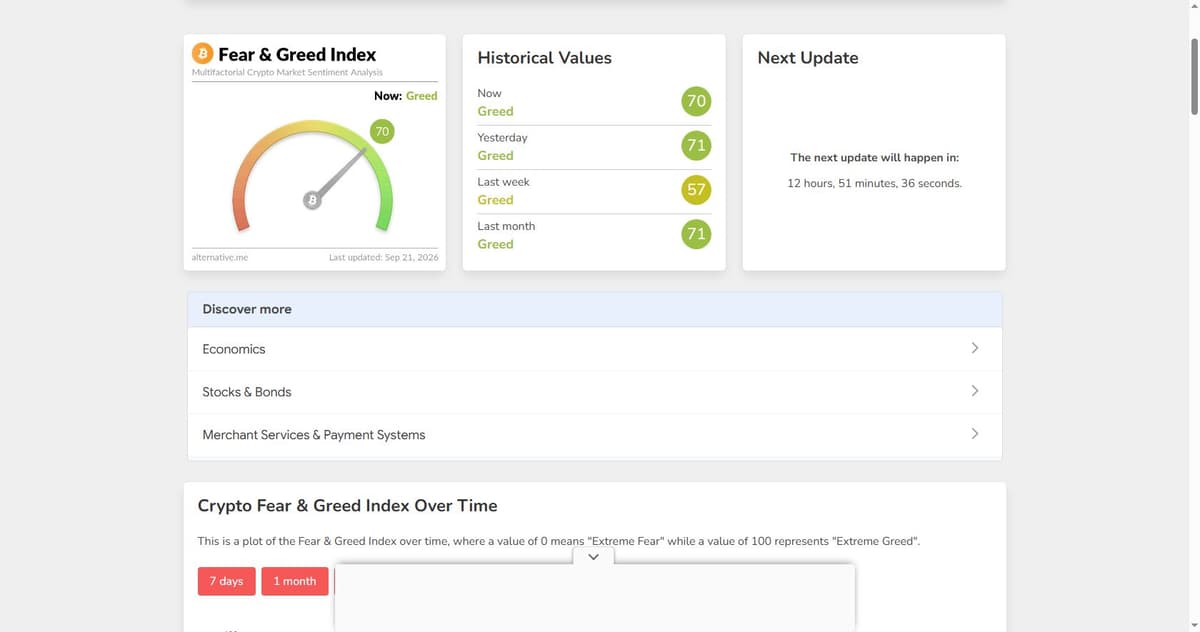
The Crypto Fear & Greed Index reads 70, “Greed,” as of today, up from 57 a week ago and 71 a month ago.
Prediction markets are leaning the same direction without full conviction. Kalshi’s year-end Bitcoin market prices roughly a 36%-39% chance of a close above $99,999.99, and a 20% chance above $110,000, both up on the day.
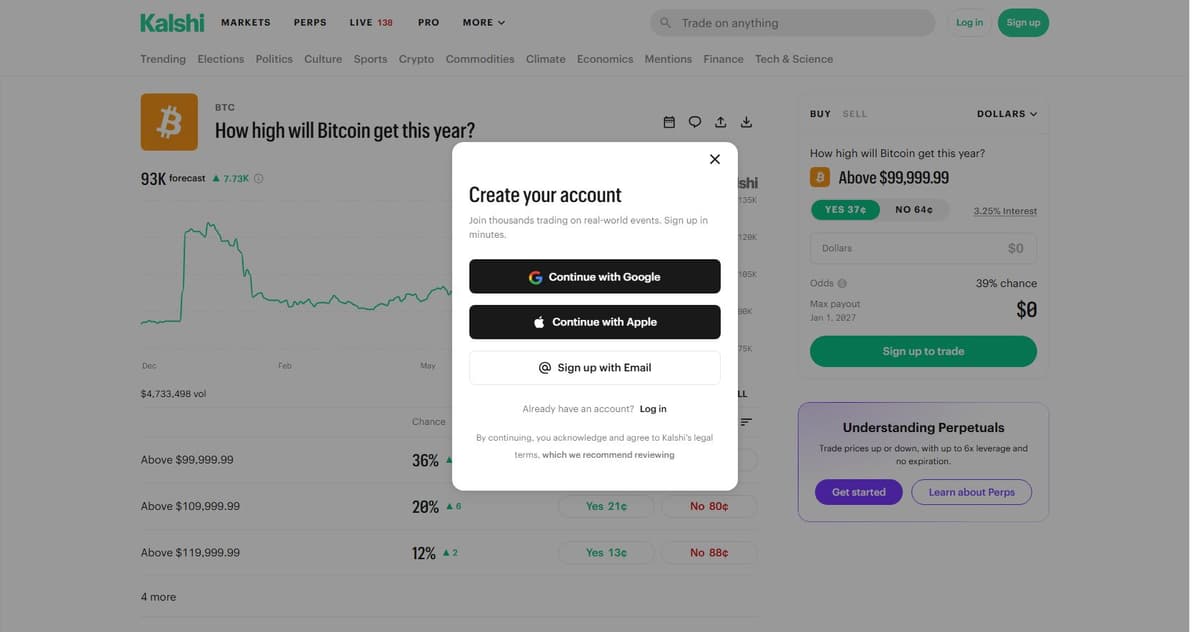
Greed readings and rising six-figure odds aren’t warning signs by themselves. They do mean the easy, cheap part of pricing in today’s news is largely done, and the next move has less room for a free pass on bad news.
What History Says About the Next Leg
The uncomfortable precedent sits in what happened the last time the Fed resumed hiking after a long pause deep in a downtrend: an initial pump gave way to a much larger correction before the trend actually turned. This week’s roughly 8-12% pump off the recent low echoes that shape closely enough to take seriously.
None of that requires the breakout to be fake. Clearing a level that turned back four prior attempts, on the back of two central bank moves and two federal agency actions, on a day where short liquidations outran long liquidations seven-to-one, is a real technical and structural shift. It just isn’t proof that the path from here is a straight line. A retest of the newly broken $81,000-$82,000 zone, rather than a rejection back below it, is the level that would actually confirm this ceiling has become a floor.