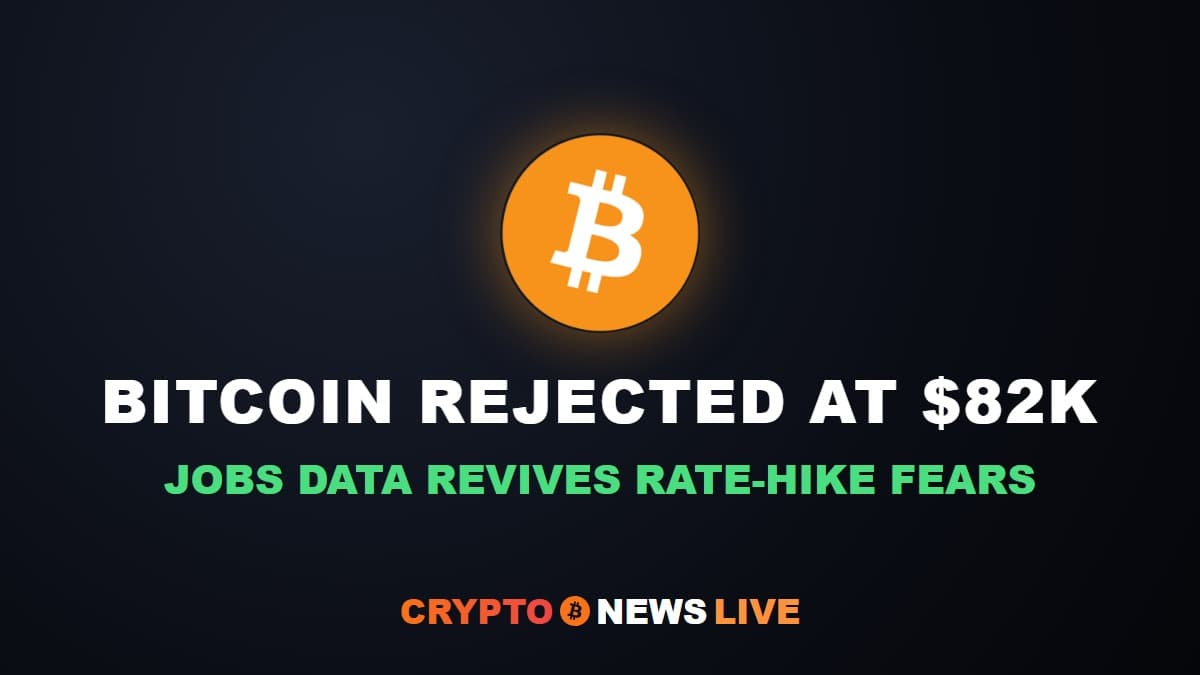
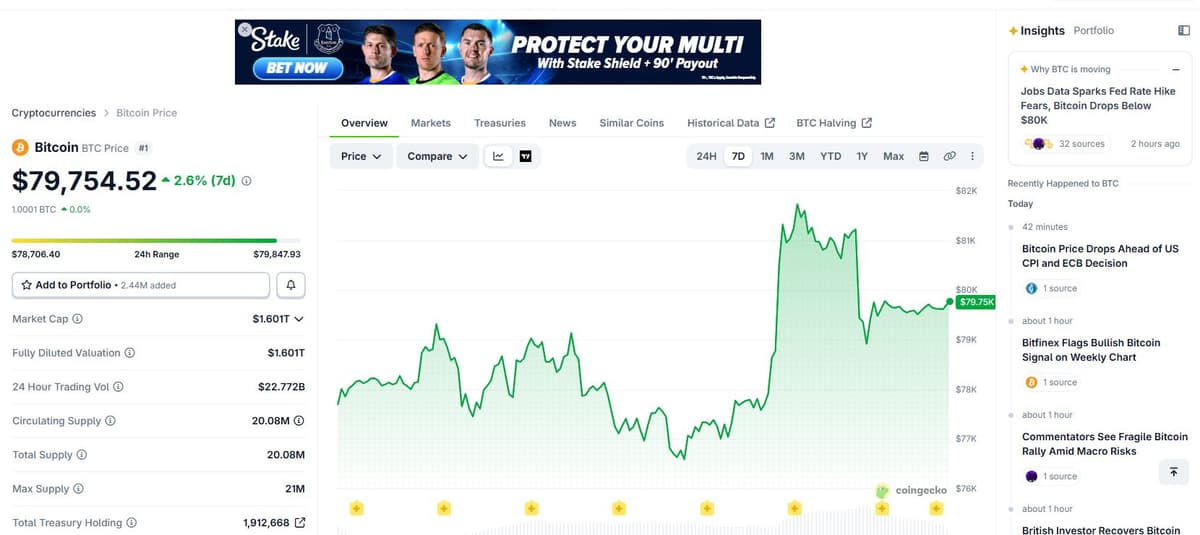
Bitcoin spent Thursday punching through $80,000 and testing $82,000 for the first time in weeks. By Friday afternoon it was sitting back under $80,000, and the reason traces to a single number out of Washington.
A Hotter-Than-Expected Jobs Report Flipped the Script
The U.S. Bureau of Labor Statistics reported Friday, September 4, that nonfarm payrolls rose by 162,000 in August, well above what markets were pricing in, while the unemployment rate held at 4.1%.
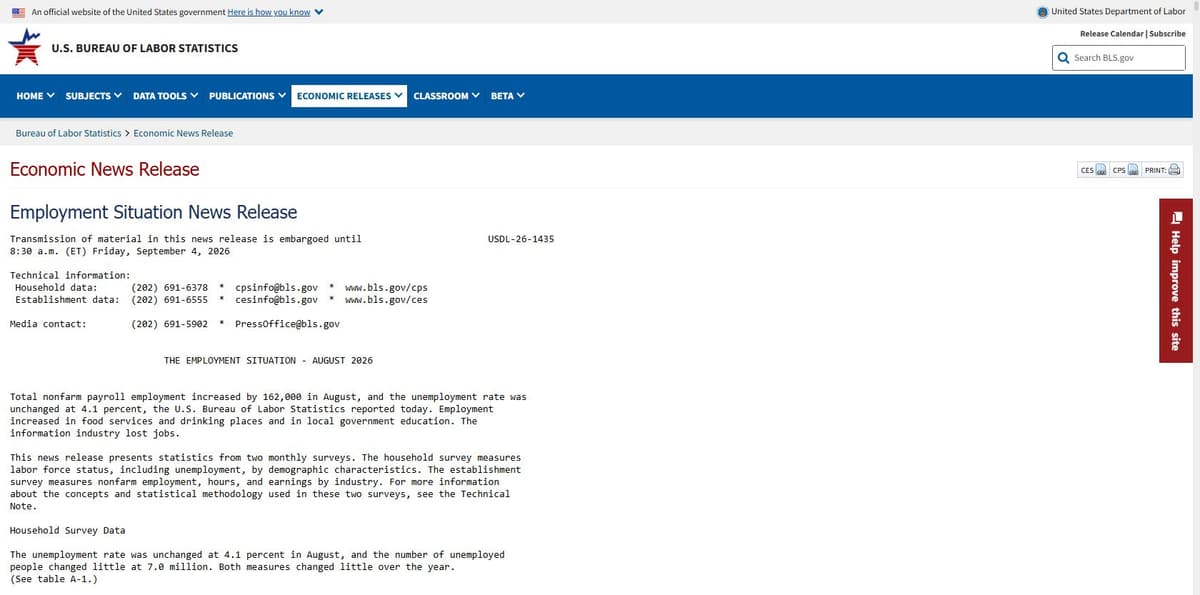
A print that strong cuts against the market’s preferred narrative of a cooling labor market clearing the way for rate cuts. Instead, prediction markets began pricing in higher odds of a rate hike at the Federal Reserve’s September 16 meeting, and risk assets, crypto included, took it as a reason to sell first and ask questions later.
President Trump responded within hours. He threatened on Truth Social to halt trade with every country the U.S. runs a deficit with, including Mexico, China, Taiwan, Germany, Japan, South Korea, Canada, and India, unless the Fed cuts rates instead. He also claimed the Supreme Court had affirmed his “absolute right” to do this. That specific claim does not hold up: the Court’s ruling narrowed presidential authority over unilateral tariff action under the statute in question, it did not expand or affirm any such absolute right. The trade-cutoff threat itself is real and on the record; the legal justification behind it is not what it was represented to be.
The Chart: A Clean Rejection at $82,000
Bitcoin’s own price action told the story before the headlines caught up. The pair broke out of a multi-week $77,000-$79,000 range, ripped straight up to roughly $81,700-$82,000, then rolled back over to settle in the high-$79,000s within about 24 hours.
A daily chart of the same move shows exactly where the rejection happened and why it mattered: Bitcoin tapped a resistance line drawn from the previous local high back in May, within roughly a hundred dollars of that old level, before turning back down. That’s not a coincidence born from nowhere; it’s the same resistance structure playing out twice.
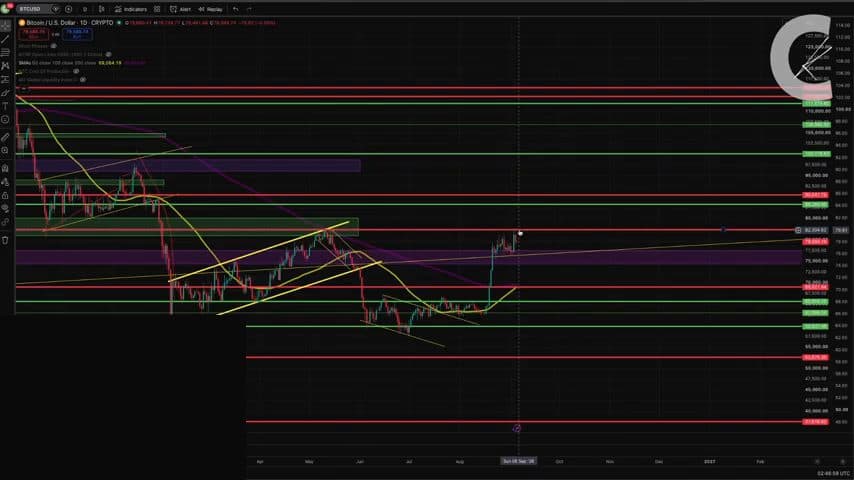
Below that, the chart also shows why the bulls aren’t out of the picture yet: the bounce off the roughly $58,000-$76,300 support structure earlier this year was sharp and decisive, while the pullback from $82,000 has so far been comparatively shallow. That asymmetry, a strong bounce off support and a soft rejection at resistance, is usually read as a sign that sellers are losing conviction even if they haven’t lost control outright.
The Weekly Close Is the Real Test
Zooming out to the weekly timeframe adds another layer. Bitcoin’s EMA ribbon, a stack of moving averages traders use to gauge trend direction, has flipped from bearish to a slight upward tilt, and price is now sitting above it for the first time since the ribbon flipped bearish on the move down from the prior cycle high.
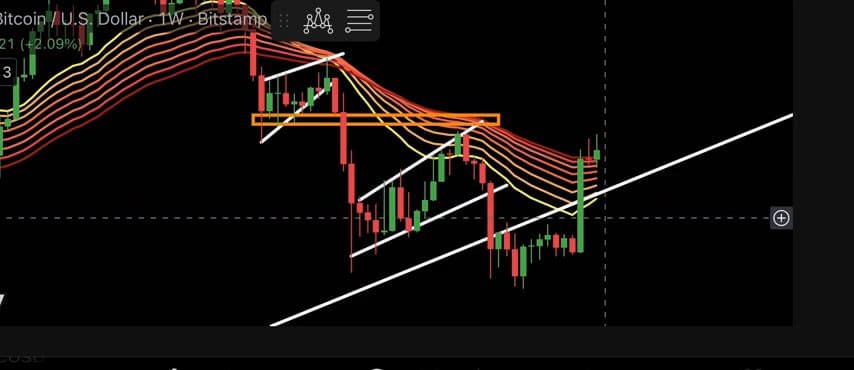
The catch is that a weekly candle needs to close above roughly $79,000-$80,000, with real volume behind it, to count as genuine confirmation rather than a wick that gets sold back into. Closing above the level without volume follow-through would leave the setup unconfirmed, with a rejection back toward the $72,000 area cited as the more likely downside target if the close fails.
Positioning and Sentiment Both Cooled Off, But Didn’t Flip
Derivatives data shows a market that got shaken out on the round trip rather than one leaning hard in either direction. Open interest across exchanges sits at roughly $138.9 billion, down marginally on the day, while 24-hour liquidations totaled about $28.3 million, split roughly $20.9 million in long positions against $7.4 million in shorts, consistent with leveraged longs who chased the breakout getting caught on the pullback.
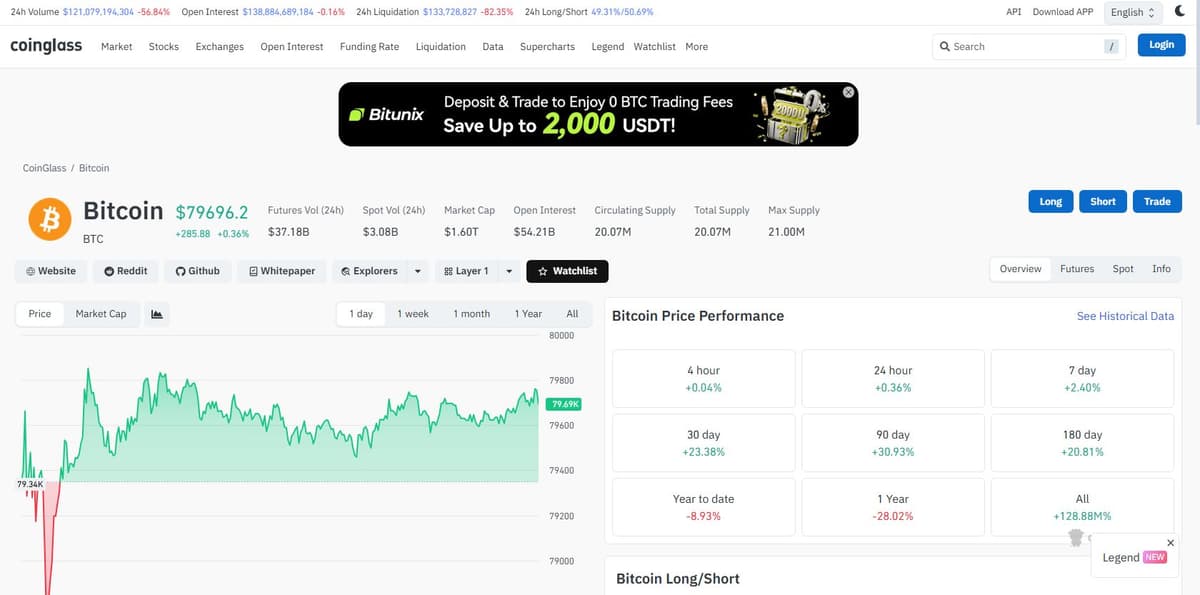
Long/short account ratios on Binance and OKX both sit modestly above 1.0, meaning slightly more accounts are positioned long than short, not a crowded one-sided bet in either direction.
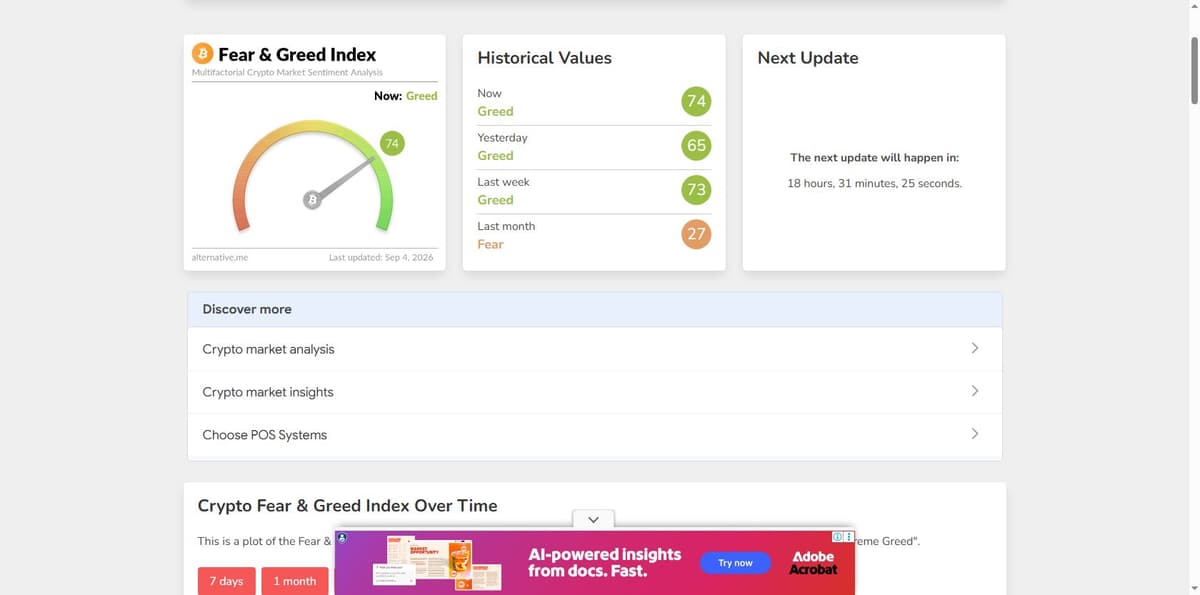
Sentiment tells a similar story of a market that’s recovered its nerve without getting euphoric. The Crypto Fear & Greed Index reads 73, Greed, essentially flat from yesterday’s 74 but a dramatic swing from the 25, Extreme Fear, reading of a month ago.
What Would Actually Confirm the Bull Case
Put together, the picture is a market that used a hot jobs print and rate-hike repricing as an excuse to test a well-defined resistance level, got turned away at almost the exact same price the May high was set, and is now waiting on the weekly candle to decide what happens next. A close above the $79,000-$80,000 zone with real volume behind it would mark a real structural shift; a close back below it, especially without volume, would put the $72,000 region back in play as the more likely destination.
September 16 adds a second catalyst on top of the technical one. That’s the date of the Fed’s next meeting, now complicated by a stronger jobs report pointing toward a possible hike and a sitting president publicly threatening to blow up trade relationships with most of the country’s largest partners if the opposite happens instead.