Everyone insisted Bitcoin traded like a leveraged Nasdaq bet. Grayscale’s own numbers, published quietly on August 27, say that stopped being true weeks ago.
The Correlation Nobody Announced
Bitcoin’s 90-day correlation with the Nasdaq 100 has fallen from north of 60% to roughly 33%. Over the same stretch, its correlation with gold climbed from barely above zero at the start of the year to more than 50%. That’s according to Zach Pandl, Grayscale’s Head of Research, in a note titled “Regime Shift: Bitcoin and the Return of the Debasement Trade.”
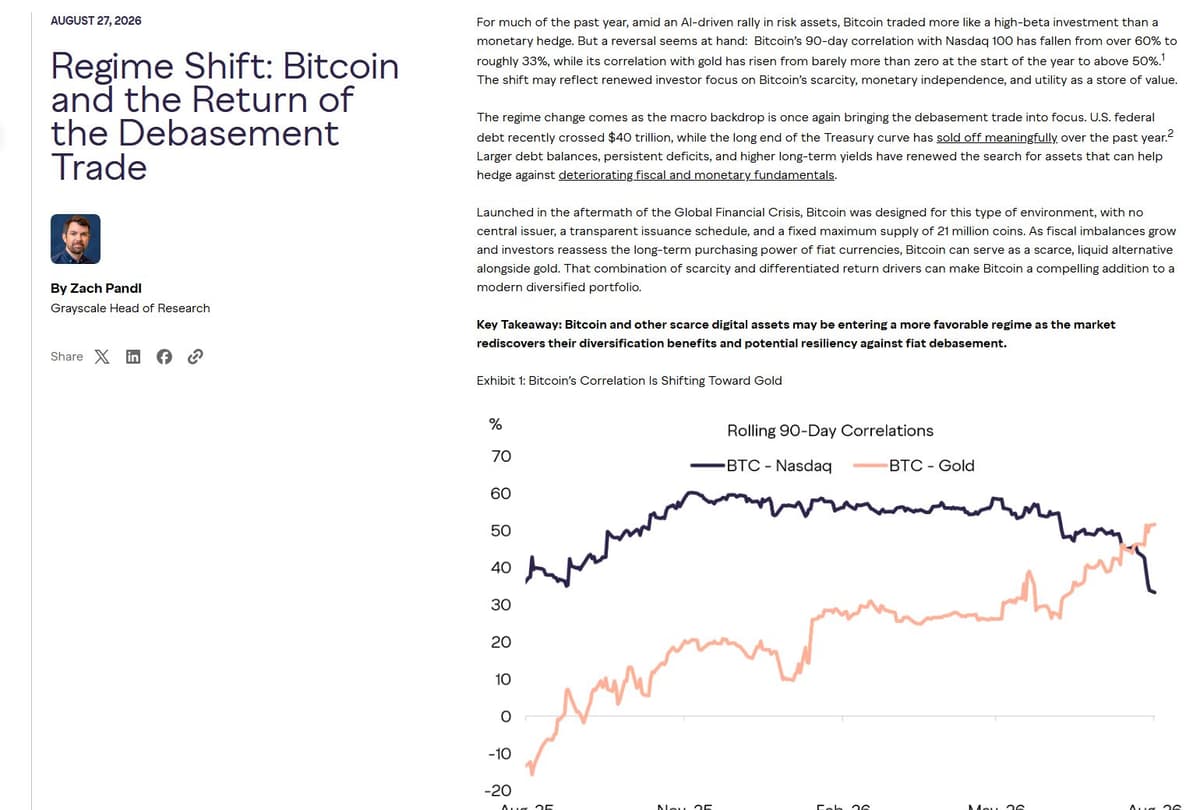
Pandl’s read, in short: rising US debt, now past $40 trillion, plus a long end of the Treasury curve that keeps selling off, is pushing capital toward things nobody can print more of. Gold. Bitcoin. Both.
Correlation isn’t causation, and a 90-day window can flip fast. Grayscale says as much itself, buried in a footnote most readers will skip past.
Gold Already Ran This Playbook
Gold’s own chart is the tell here. Spot gold ran from roughly $3,880 in October 2025 to an all-time high of $5,595.92 on January 29, 2026, a rally north of 40%. Then it gave back 27.6 percent of that, bottoming near $4,053.11 by the end of July, per independent tracking of the correction.
Bitcoin’s version was rougher, honestly. From its own October 7, 2025 high of $124,740 to a July 2026 low around $58,566, BTC shed 53 percent, roughly twice gold’s drawdown on the way down. The shape, though, direction and timing, tracked closer than the “digital gold” skeptics like to admit.
Two assets. Same macro trigger. Wildly different volatility. That’s the whole debasement trade in one sentence.
Where The Chart Watchers Are Actually Buying
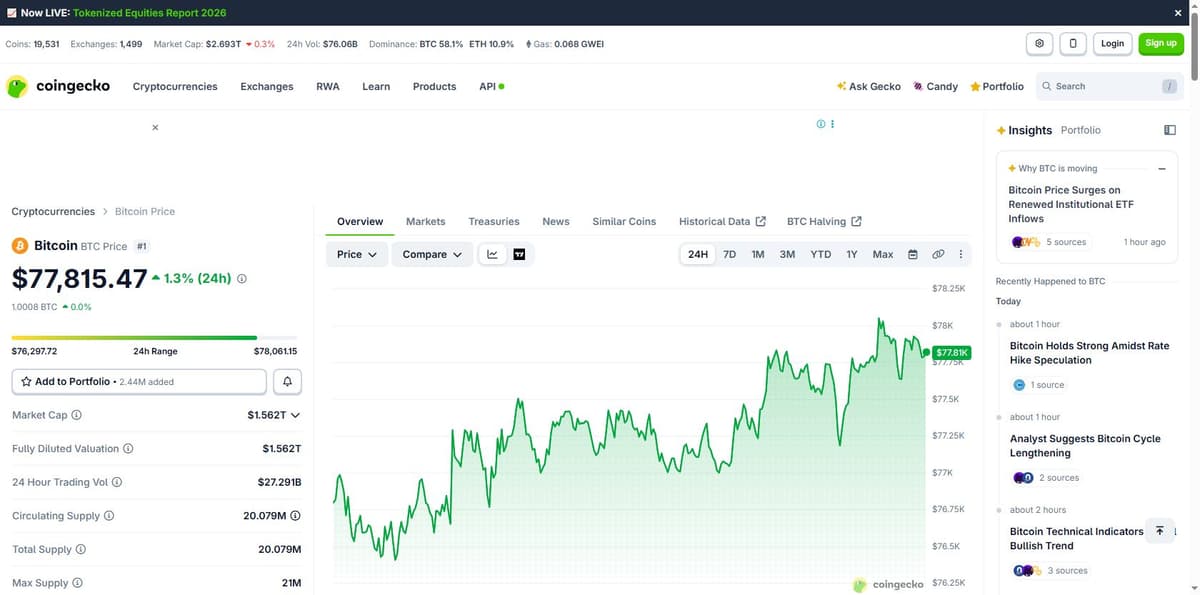
Bitcoin sits at $77,815 as of this writing, up 1.3 percent on the day. Ether trades near $2,403. Solana’s back above $100 at $100.62. XRP has recovered to $1.37. All four had been sliding for roughly a week, with Bitcoin briefly losing the $77,000 handle, Ether dipping under $2,400, Solana falling below $100 and XRP touching $1.33.
Technical readers watching Bitcoin’s daily chart have flagged a specific band as the level that matters if the slide resumes: $62,000 to $66,000. That range lines up with a Fibonacci golden zone directly beneath the last major liquidity pocket left over from June’s chop, the kind of confluence chart analysts treat as real support, not just a round number someone picked out of the air.
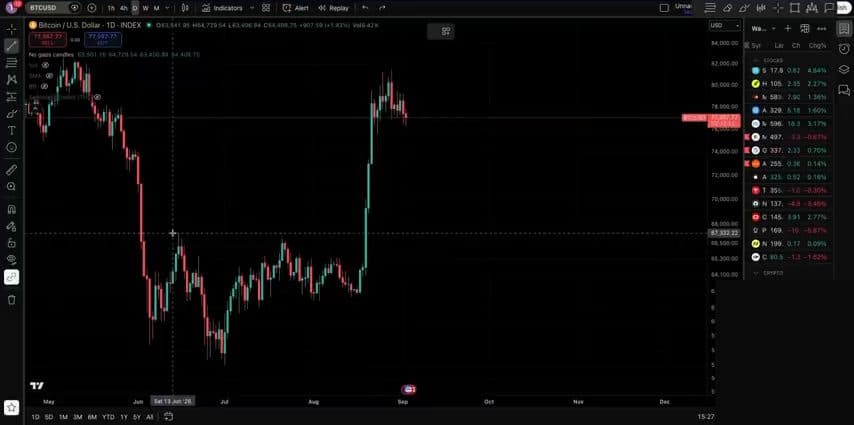
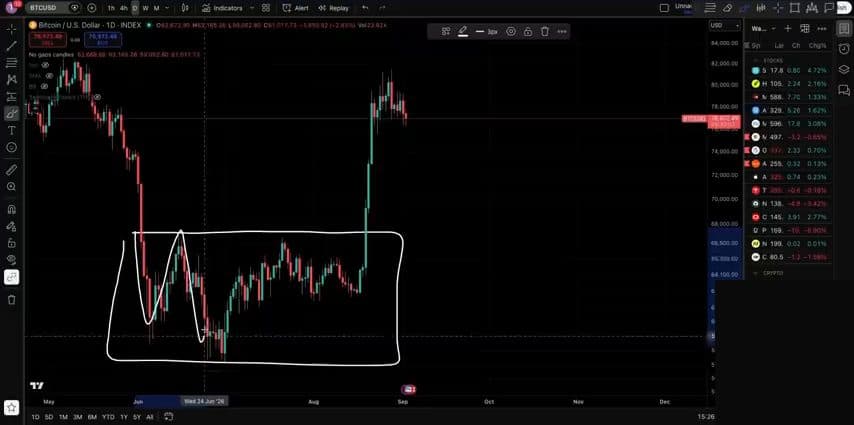
Whether that zone holds or gets swept decides if this reads as a routine pullback inside an uptrend. Or something worse.
The Headline Risk The Market Keeps Shrugging Off
While Grayscale was publishing correlation charts, the US and Iran traded their biggest exchange of fire since July. President Trump told reporters at the White House on September 3 that the strikes “took out all of the new equipment that they tried to build along the Strait of Hormuz,” adding, “it was a very heavy attack last night, and we’re prepared to do another one, anytime we want,” Al Jazeera reported.
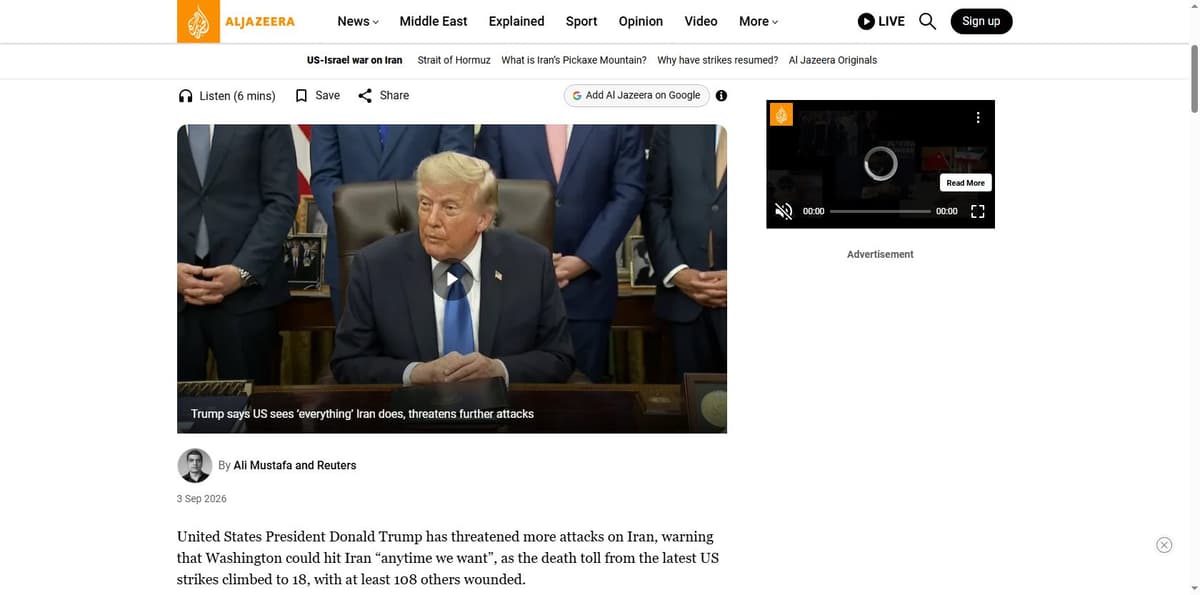
Iranian officials put the death toll from the latest strikes at 18, with at least 108 wounded. That includes a strike on a wedding party in Kuhestak that Iran’s foreign ministry spokesman called a war crime. Iran retaliated against US bases in Bahrain, Iraq and Jordan.
The S&P 500 and Nasdaq both closed green the day after. That’s either a sign markets have priced this conflict in already, or a sign they’re not paying attention. Three days before this latest strike round, both indices had been dropping off a cliff on the exact same story, so take your pick.
Two Ways This Plays Out
If the correlation shift Grayscale flagged holds and gold keeps behaving as the reference asset, Bitcoin’s pullbacks likely get bought the way gold’s own 27.6% correction eventually was, because the underlying debasement thesis doesn’t care about a single bad week.
If the Iran conflict escalates past what a “very heavy attack, anytime we want” threat implies, Bitcoin’s 53% round-trip from last October is the more honest guide to what a real risk-off shock does to this asset, regardless of what its 90-day correlation chart said in August.
Both are live right now. Neither has resolved.