
Bitmine’s own press release list puts its Ethereum holdings at 5.96 million ETH on September 14 and 6.02 million on October 5. U.S. spot Ethereum ETFs went the other way. Every session from Tuesday, September 29 through Friday, October 9 ended in a net outflow.
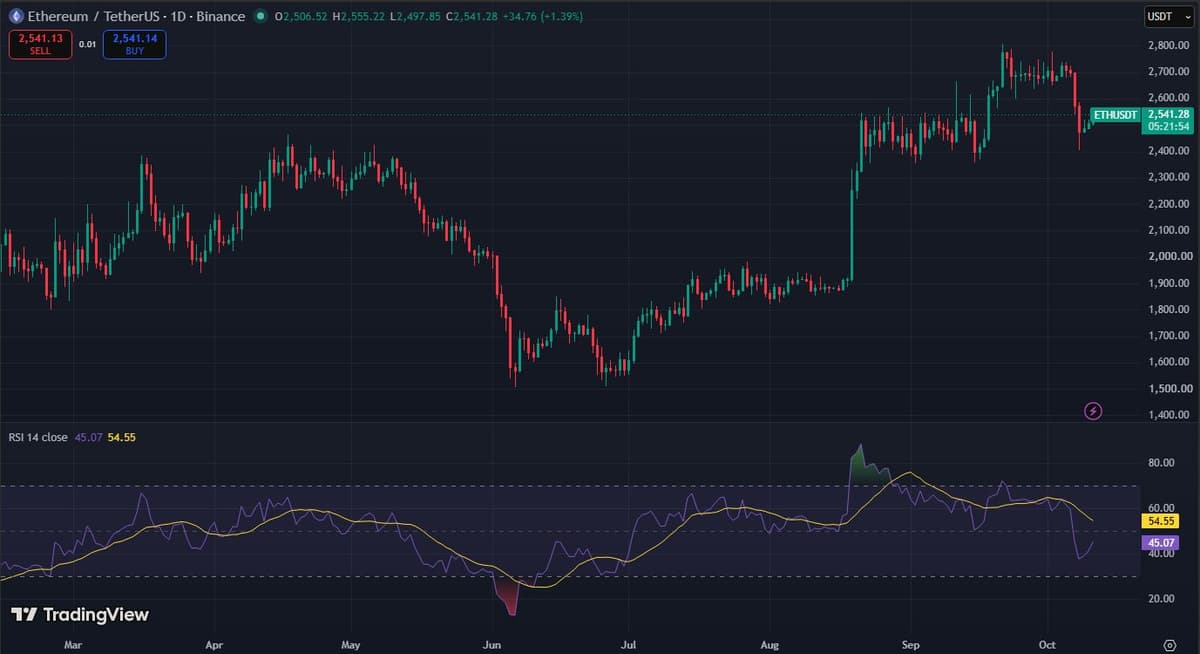
The ETH price stood at $2,535.73 on Binance spot at the 16:00 UTC four-hour close on Sunday, October 11. That is 6.0% under Tuesday’s close.
Tuesday, October 6 closed at $2,697.49 on the Binance daily candle. Thursday’s low was $2,406.11, printed in the 16:00 UTC four-hour candle. The fall from one to the other is 10.8%, and it took just two daily candles.
Wednesday Did the Damage to the ETH Price
Wednesday opened at $2,697.49 and closed at $2,574.14, down 4.6%. Spot volume that day was about $1.13 billion, against $626 million on Tuesday. Thursday added the low for the ETH price and closed at $2,474.80.
Wednesday’s close also sat under $2,650.88, the October 2 low. That ended a run of higher lows on the daily chart that began September 24. The daily trend now reads down. Weekly trend still reads up, since it broke upward on August 31.
Nine ETF Sessions, Nine Outflows
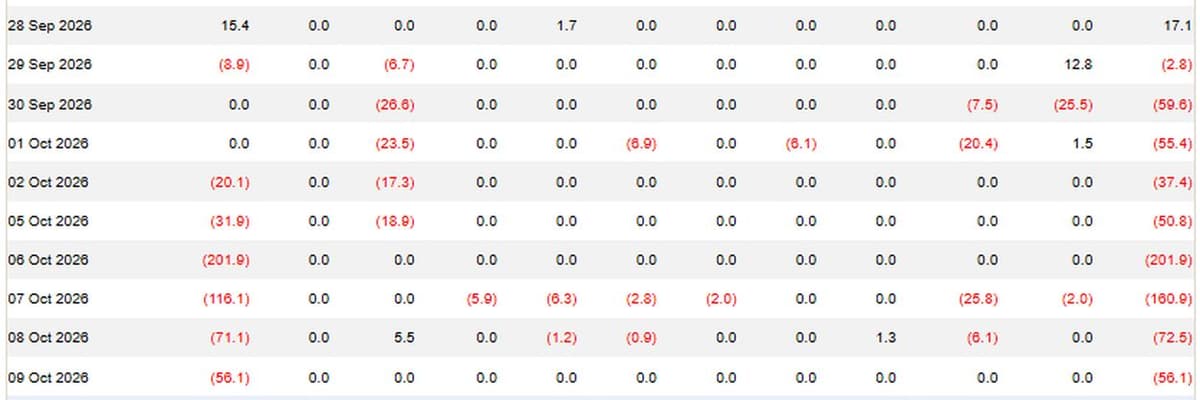
Farside’s Ethereum ETF table lists a net outflow for each of the nine sessions between September 29 and October 9. They add up to $697.4 million. The week of October 5 alone came to $542.2 million, the largest weekly outflow in the table since the week of January 19 ($600.7 million).
A week earlier, September 21 to 25, the same funds took in $689.8 million.
One fund carried most of it. The ETHA column, the iShares Ethereum Trust, shows $477.1 million of that $542.2 million. Tuesday, October 6 was the heaviest single day at $201.9 million. Flows and the ETH price overlapped in time, and the table says nothing about motive.
Corporate buyers read differently. Bitmine’s page lists weekly releases dated September 14, 21 and 28 and October 5, with holdings of 5.96 million, 5.98 million, over 6 million and 6.02 million ETH. The October 5 one also gives $17.4 billion in total crypto, cash and securities. Another release would be due Monday, October 12 if the weekly pattern holds.

ETH Lagged Bitcoin by Four Points
Bitcoin barely flinched by comparison. Tuesday’s close was $85,549.93. Sunday’s 16:00 UTC close was $83,908.89, so off 1.9%. ETH did worse at 6.0% down. Priced in Bitcoin, ETH slid on the ETH/BTC chart from 0.03153 to 0.03022.
Bitcoin itself is riding above the 100-day average. ETH is stuck inside its range. Above it is the $2,807.34 high from September 21, below it Thursday’s $2,406.11. CryptoNewsLive’s weekly close piece and its Iran strike report cover the Bitcoin side of the same days, and the XRP top-down shows how another large coin sat through them.
Funding Went Negative, Accounts Stayed Long
Funding on Binance’s ETH perpetual went negative on Sunday. The first print, at 00:00 UTC, was -0.0118%. The 08:00 UTC print came in at -0.0117%. By 16:00 UTC it was back to +0.0012%, per the funding history.
Open interest fell from $6.17 billion to $5.78 billion between October 8 and 9, according to Binance’s daily series. It was $5.87 billion at 18:00 UTC on Sunday.
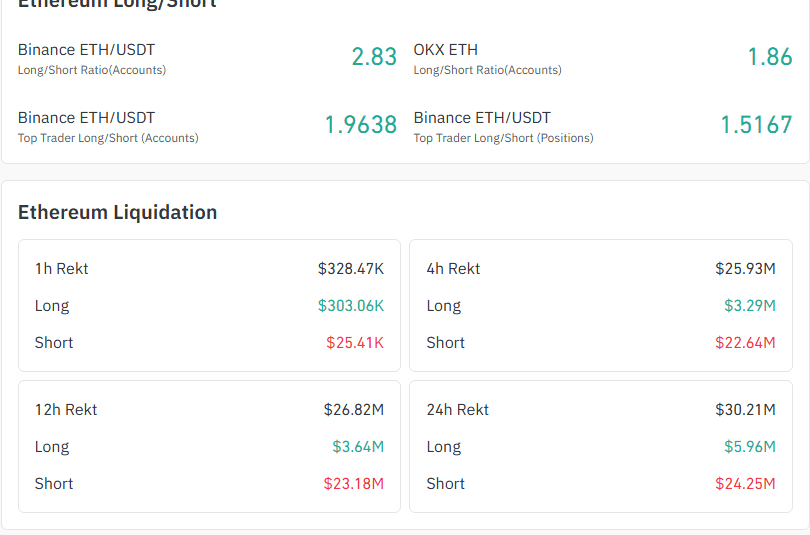
Coinglass had the long-to-short ratio of Binance accounts at 2.83, which is about 74% long, and OKX at 1.86. Binance’s top traders read 1.96 by accounts and 1.52 by positions. The site counted $30.21 million of liquidations over 24 hours. Shorts were $24.25 million of it. Most got hit in the last four hours.
Four-Hour Closes That Would Change the Picture
The Binance four-hour candles give two lines. Thursday left a gap on the daily chart. It runs from $2,587.28 to $2,683.73, and price has not traded back into it. Saturday’s close put the daily EMA20 at $2,607.38 and the EMA50 at $2,502.22. The EMA200 sat much lower at $2,301.91. That leaves the ETH price between the 50 and the 20.
Up case: a 4-hour close above $2,587.28 opens the gap. Targets are $2,683.73 and then $2,725.13, the October 6 high. A 4-hour close back under $2,545.19 cancels it.
Down case: a 4-hour close under $2,474.34, the low of the October 9 16:00 candle, points to $2,406.11 and then $2,358.88, the September 15 low. A 4-hour close back above $2,519.51 cancels it.
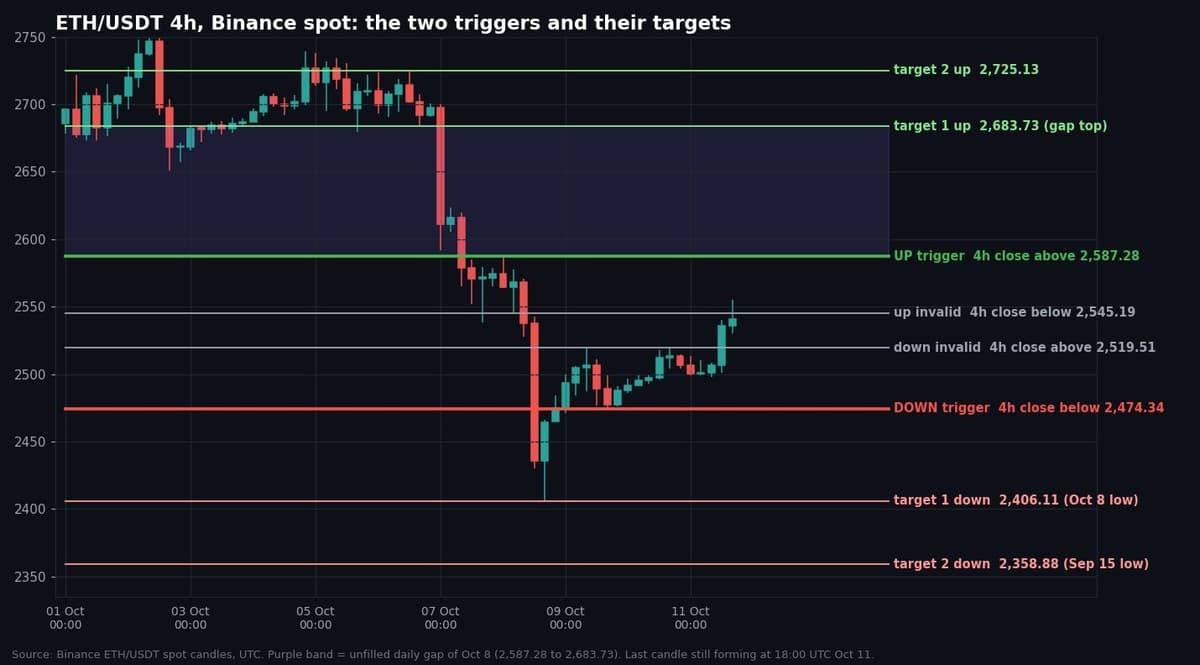
The evidence on the ETH price is balanced. Bitcoin’s trend is up, ETH’s daily structure is down, and neither trigger had fired at the 16:00 UTC close on Sunday.
Bitmine’s next release would come Monday, October 12. September CPI is due Wednesday, October 14, per the BLS schedule, at 8:30 a.m. Eastern or 12:30 UTC. Then the Fed meets October 27 and 28, per its calendar. The committee hiked a quarter point on September 16.