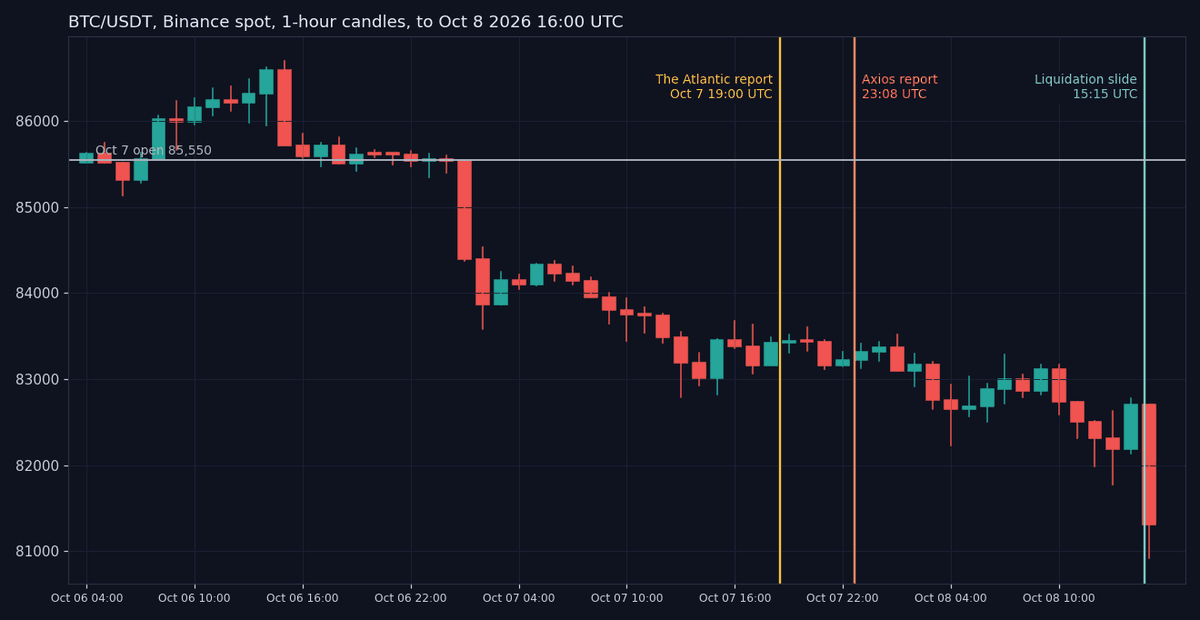
Bitcoin opened Wednesday, October 7 at $85,550. By 13:00 UTC it had touched $82,787, down 3.2%.
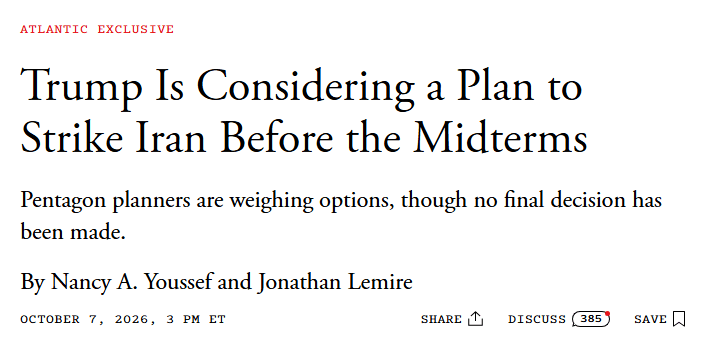
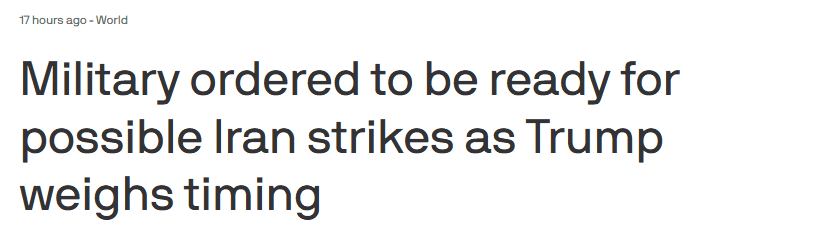
The first report that the Pentagon was weighing new Iran strikes came six hours after that low. The Atlantic posted it at 19:00 UTC and Axios followed at 23:08 UTC, so the Bitcoin price had done most of its Wednesday falling before either story existed.
Bitcoin Price Flat After Both Headlines
The Atlantic’s piece said Pentagon planners are weighing options, with no final decision made. Axios reported that the Pentagon told U.S. Central Command several days earlier to finish preparations for resuming major combat operations, with no date and no decision from President Trump.
The Bitcoin price opened the 19:00 UTC hour at $83,422 and the 23:00 UTC hour closed at $83,322. That is about $100 lost in five hours after the first report, against roughly $2,760 lost in the thirteen hours before the low. Binance candles show the same picture: the real legs down came at 01:00 to 02:00 UTC and again in the 13:00 UTC hour.
The Outflow Day Came First
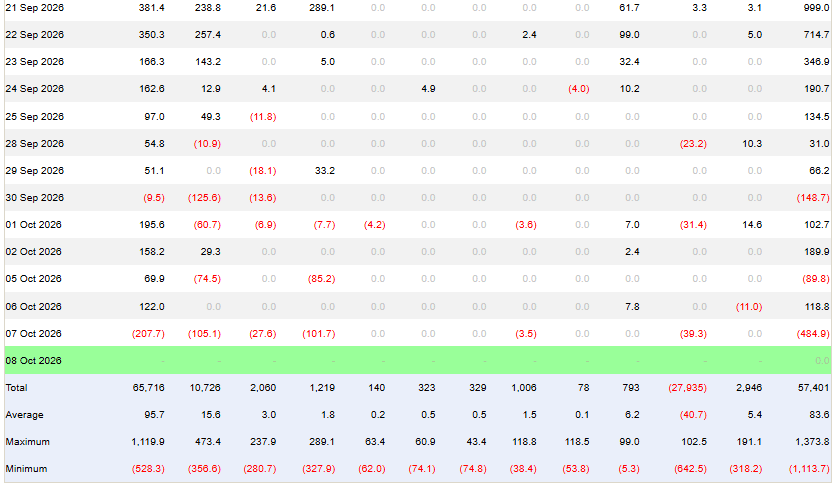
Farside Investors logged a net outflow of $484.9 million from U.S. spot Bitcoin ETFs on Wednesday. IBIT shed $207.7 million, FBTC $105.1 million and ARKB $101.7 million. It is the biggest outflow among the 13 sessions with data on Farside’s page, which starts September 21.
The outflow and the Bitcoin price drop share a date, and Farside’s daily table cannot show which came first. The day’s low printed in the 13:00 UTC hour, the hour U.S. funds began trading. The first five sessions on the page told the opposite story, with about $2.39 billion of net inflows from September 21 to 25.
Oil and Yields Took Over on Thursday
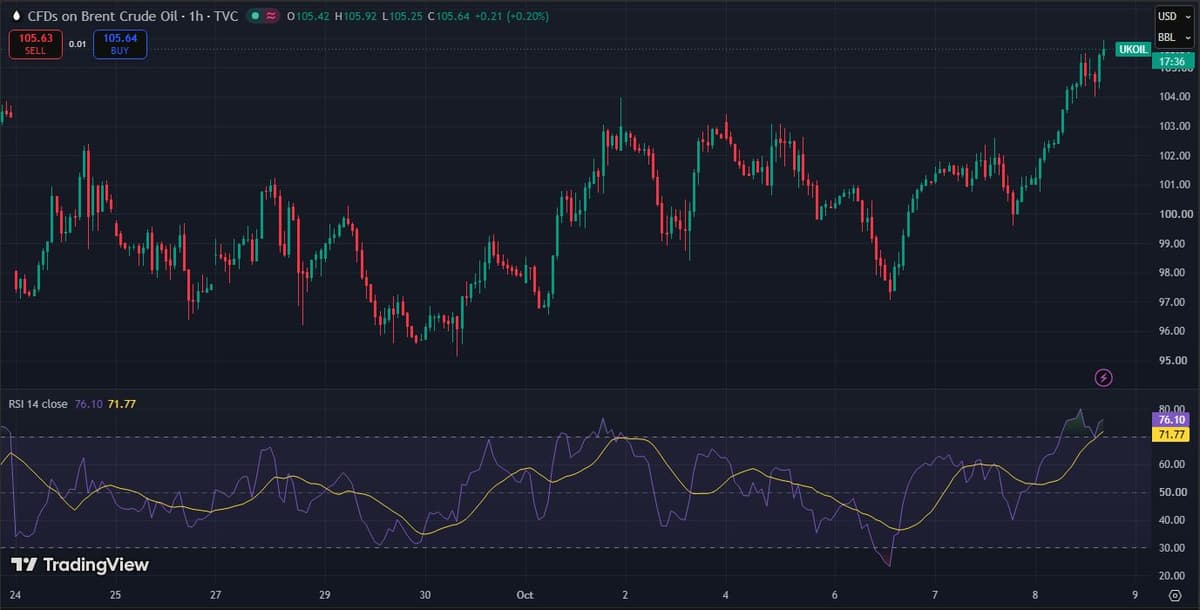
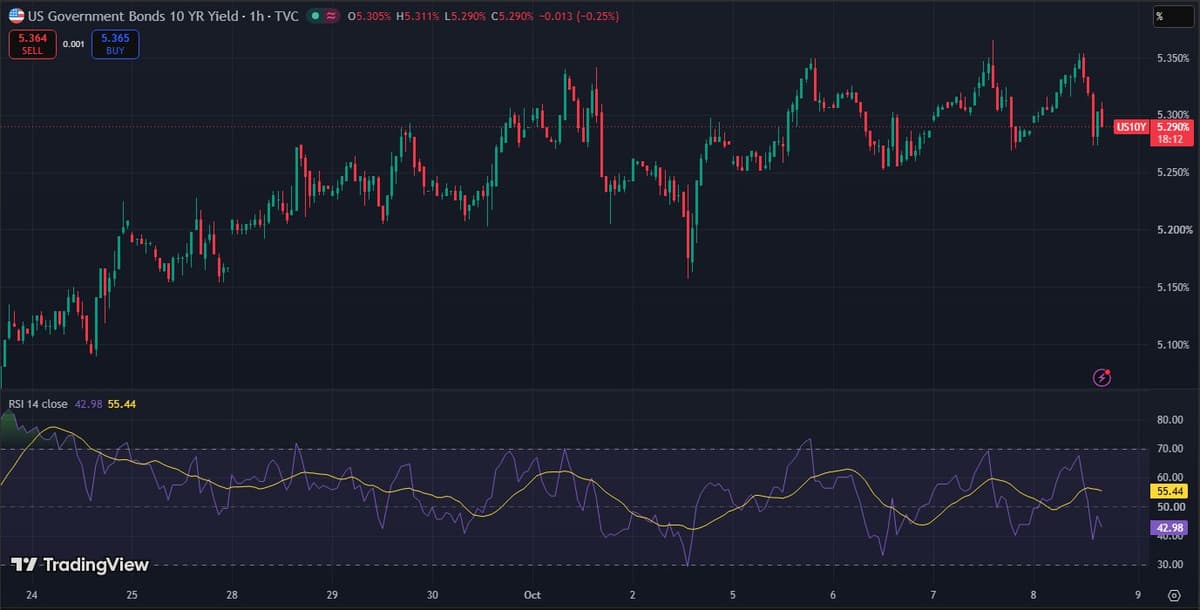
NBC News reported at 14:01 UTC that Brent crude rose more than 5% to above $105 a barrel and U.S. crude to nearly $93. The 10-year Treasury yield jumped to 5.35%. The S&P 500 fell 0.4% and the Nasdaq 0.6%. NBC said no decision on resuming operations has been made, and that Strait of Hormuz traffic averaged fewer than 23 ships a day from September 28 to October 4, per MarineTraffic.

On TradingView, Brent stood at $105.62, up 4.36% on the day, at 15:42 UTC. The 10-year yield read 5.290% at 15:41 UTC, below the 5.35% NBC cited earlier.
Bitcoin Price Slid at 15:15 UTC
Bitcoin sat between $82,390 and $82,725 on five-minute closes from 14:10 to 15:05 UTC. Then it stepped down. The 15:20 candle traded $50.6 million against $3 million to $13 million in the candles before it, and the low of $80,914 printed at 15:35. A lower one followed: $80,801 at 16:05.
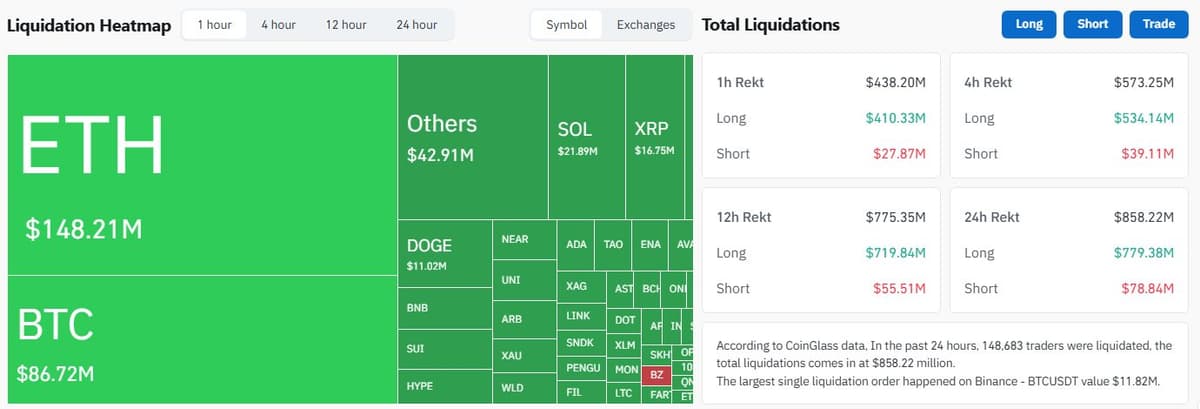
Coinglass showed $438.2 million of liquidations in the past hour, $410.3 million of it longs. Over 24 hours the total was $858.2 million, with $779.4 million, about 91%, on the long side. ETH liquidations of $148.2 million topped Bitcoin’s $86.7 million, and the largest single order was an $11.82 million BTCUSDT liquidation on Binance.
Oil’s jump and the yield move were already in NBC’s 14:01 UTC story, and the Axios report was 16 hours old by 15:15 UTC. Nothing in those sources lines up with that exact time.
Altcoins fell harder. Measured from Thursday’s 00:00 UTC open to 16:25 UTC on Binance spot, ETH was down 5.6%, SOL 6.5% and XRP 4.7%, against 2.4% for Bitcoin.
Levels After the Flush
Bitcoin ran from $81,178 to $86,620 on September 21 with about $999 million of ETF inflows, a move we covered alongside the PCE reaction and the halving-window math. Three highs, $87,396 on September 21, $87,220 on October 2 and $86,999 on October 5, sit within $400 of each other, and each one failed.
The 200-day average sits at $71,765, about 12% under price, and the 100-day average at $72,055. The Bitcoin price is above both, yet it has slipped under its 10-day low, a bearish trend-following signal.
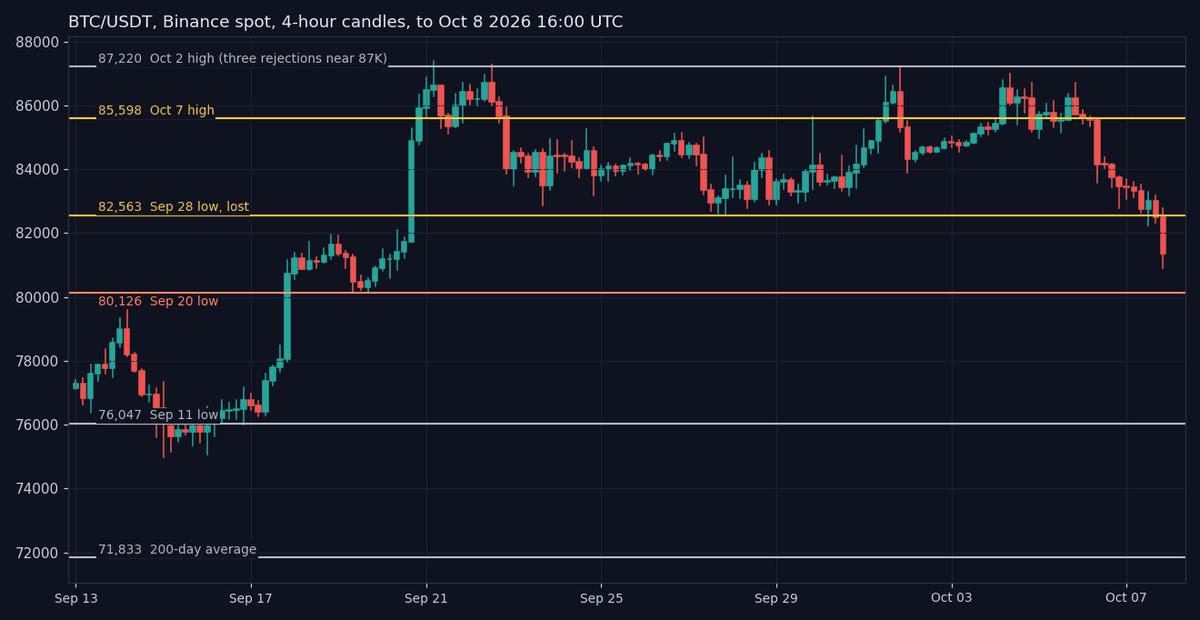
Bear case for the Bitcoin price: a 4-hour close below $80,126, the September 20 low, opens $76,047, the September 11 low. A 4-hour close back above $82,563, the September 28 low, cancels it.
Bull case: a 4-hour close above $82,563 opens $85,598, Wednesday’s high. A 4-hour close back under $81,000 cancels it. Thursday’s $80,801 low is a live number as of 16:25 UTC, and prices are Binance spot unless stated.