
The Bitcoin price closed Sunday, October 11 at $83,773.12 on the Binance daily candle. That sits well above Thursday’s low of $80,393.56 and still under the $87,395.67 high from September 21. Three government data releases land this week, and the inflation one comes first.
ETF Outflows Behind the Price Dip
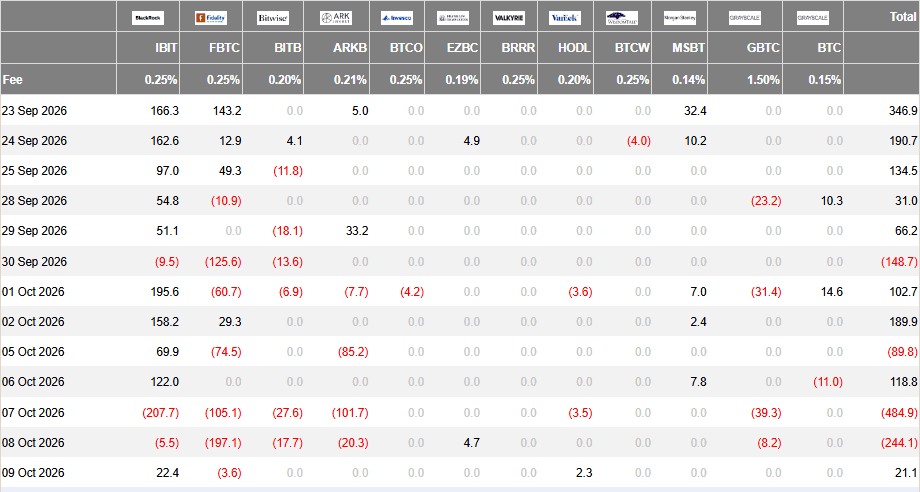
Farside’s Bitcoin ETF table lists a net outflow of $678.9 million for the five sessions from Monday, October 5 to Friday, October 9. Wednesday took out $484.9 million and Thursday another $244.1 million. Tuesday added $118.8 million and Friday $21.1 million.
The week before, September 28 to October 2, the same funds took in $241.1 million.
The heavy outflow days overlap with the Bitcoin price slide from the $85,549.93 close on Tuesday, October 6 to the $80,393.56 low on Thursday. The table does not say why anyone sold, and Monday’s flows are not published yet.
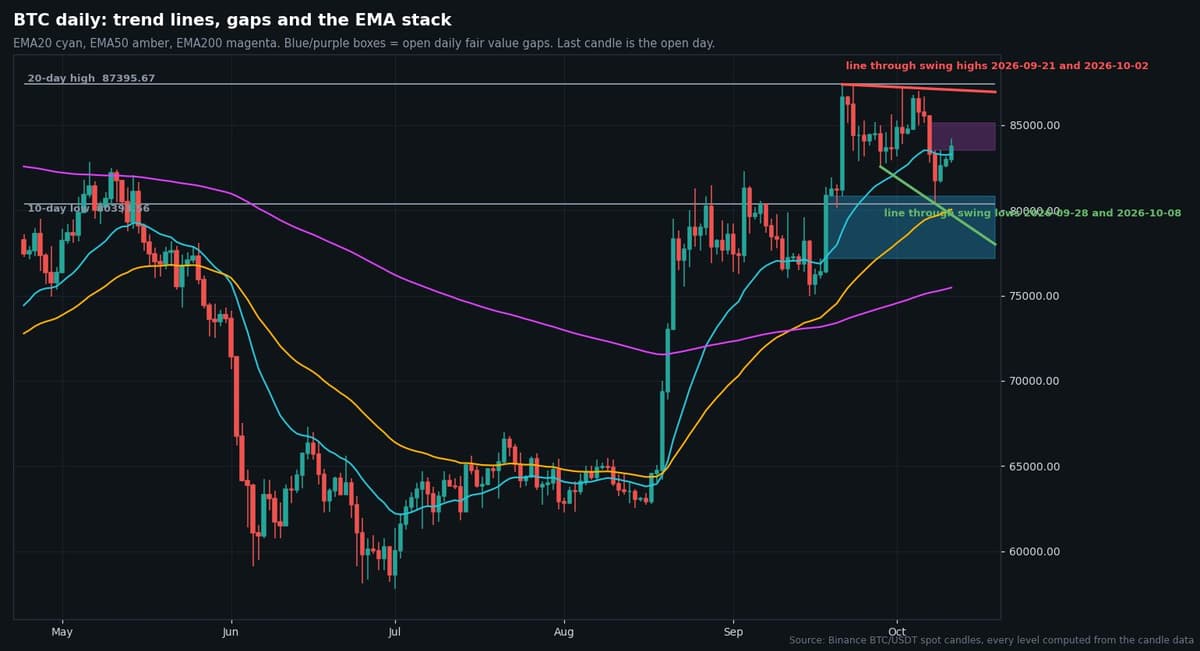
Bitcoin Price Against Its Moving Averages
Take the 50-day simple average of daily closes, which stood at $80,964.41 after Sunday’s candle. Thursday’s low went under it, since the average was $80,545.20 that day, and the candle still closed at $81,754.45. The Bitcoin price has not closed a day below that line in the last seven.
The 200-day average is $72,017.69. The 50-week average, using weekly closes through the week that began October 5, is $77,152.86. Both sit below the 50-day line.
Above the 100-day average of $72,938.15, too, and that line is climbing (it read $71,823.94 five days ago). By that test the Bitcoin price is in an uptrend.
Weekly structure still reads up. The daily one has read down since October 8, when the September 28 swing low of $82,563.00 broke on a close. Friday and Saturday both traded under that level and closed back above it, at $82,635.55 and $82,988.36.
Three Releases and a September Fed Hike for the Price to Digest
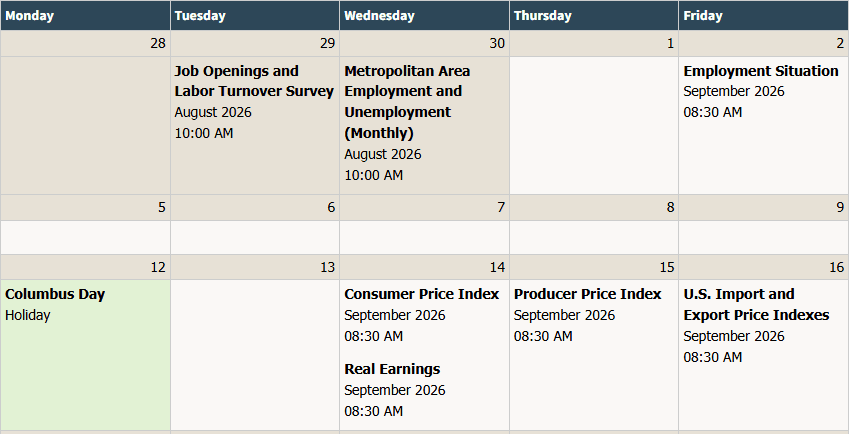
Circle Wednesday, October 14. At 8:30 a.m. Eastern the BLS release calendar slots in September’s Consumer Price Index. In UTC it reads 12:30. Real Earnings drops at the same moment. Producer prices wait until Thursday, October 15, import and export prices until Friday, October 16, and Tuesday has nothing at all.
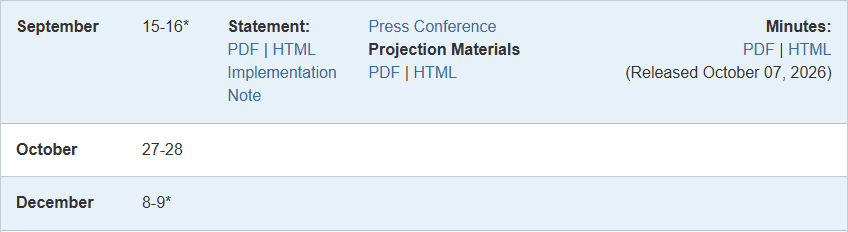
The backdrop is different from last year. The Fed’s September 16 statement is plain about it: a quarter-point raise, to 3¾ to 4 percent. The rate table agrees and dates it September 17. That is the only change of 2026. Before it, the December 11, 2025 cut had parked the range at 3.50 to 3.75.

Wednesday’s print comes ahead of the next FOMC meeting, October 27 and 28, per the Fed’s meeting calendar.
Futures Positioning Under the Bitcoin Price
Binance’s USDT-margined futures, 05:00 UTC Monday, per the exchange’s own open interest data: 92,378 BTC outstanding, roughly $7.73 billion. The 30-day peak was 109,189 BTC, so the book is 15.4% lighter. Funding at the last three settlements ran -0.001%, 0.0013% and 0.0006%, near zero either way. And 57.7% of accounts were long.
None of that is a forecast. Leverage under the Bitcoin price stood 15.4% below its 30-day high when the week started, and funding was close to flat.
Two Price Paths Into Wednesday’s 12:30 UTC Print
The up path starts with a four-hour close above $84,199.00, Sunday’s daily high. That opens $86,698.99, the October 6 four-hour high, and then $87,395.67. A four-hour close back under $82,804.65, Sunday’s 04:00 UTC low, cancels it.
The down path starts with a four-hour close under $82,563.00. The first target is $80,393.56, the Thursday low, which sits right next to the 50-day average. Under that comes the 50-week average at $77,152.86. A four-hour close back above $83,528.98 cancels it.
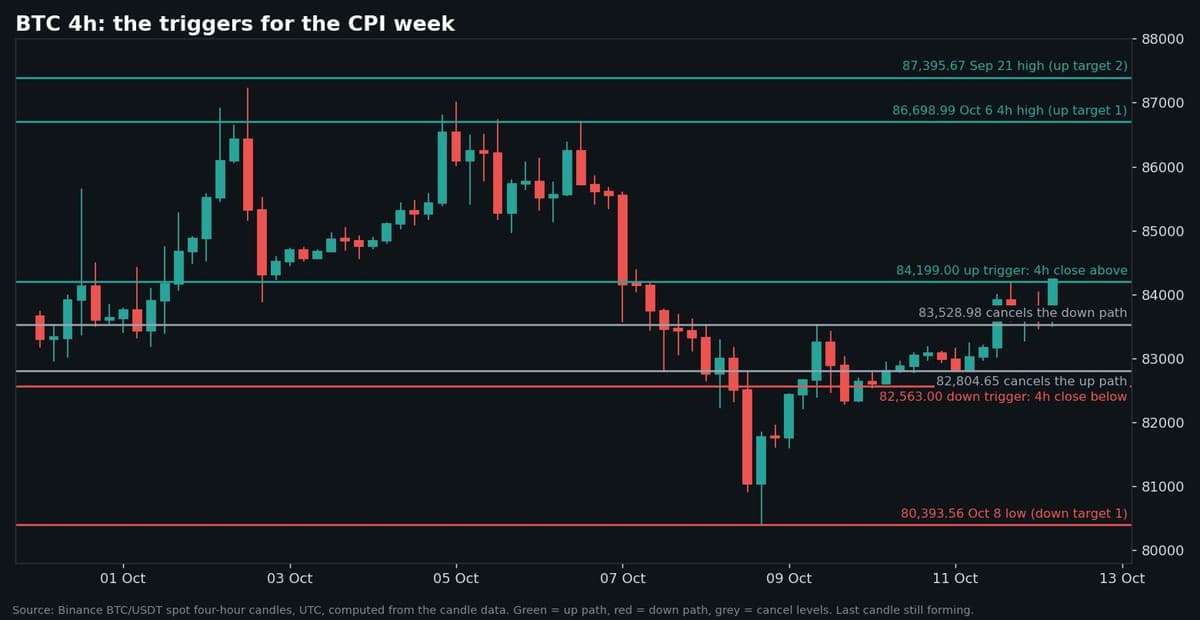
The Bitcoin price evidence is balanced into the release. The regime leans up, the daily structure leans down, and neither trigger had fired at the 00:00 UTC four-hour close of $83,613.06 on Monday, October 12.
Earlier reads on this setup are in the weekly close piece and the Iran strike timing study. The ETF side is covered in the Ethereum outflow article.
The rest of the calendar: CPI Wednesday at 12:30 UTC, PPI Thursday, import and export prices Friday. Then the FOMC, October 27 to 28. Any Bitcoin price read before then is a snapshot.
Not financial advice. Bitcoin went from $85,549.93 to $80,393.56 in two sessions this month, and leveraged positions can be liquidated on moves that size.