The Pump.fun buyback cost about $760,000 a day over the last seven days, 39% less than the $1.24 million a day it cost in the first week of October, according to the burn record on Pump.fun’s own site. The PUMP token traded near $0.0041 on Binance on 30 October, about 31% below its price a month earlier.
The Pump.fun buyback comes from revenue. Pump.fun, the Solana platform where people launch new tokens, puts half of what it earns into buying PUMP on the open market and then destroys what it bought. When revenue drops, the buyback shrinks with it. A lower token price shrinks the dollar figure a second time.
How the Pump.fun buyback is funded
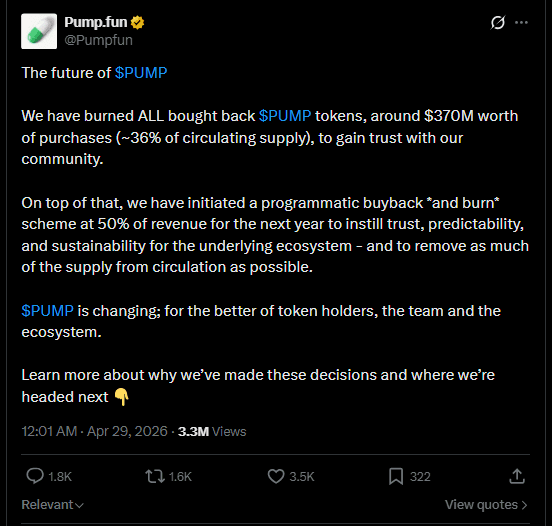
Pump.fun said in a post on X on 28 April (UTC) that it had burned all the PUMP it had bought back so far, about $370 million worth, and had started a scheme that spends 50% of revenue on buying and burning the token for the next year.
The burn record shows that rule in action. On each of the last ten days the purchase took between 48.6% and 52.0% of revenue. The newest row, for 29 October, shows 180.8 million PUMP burned for about 7,800 SOL, or $802,700. The page puts the total since launch at $497.93 million, which removed 174.58 billion PUMP, or 17.458% of the total supply.
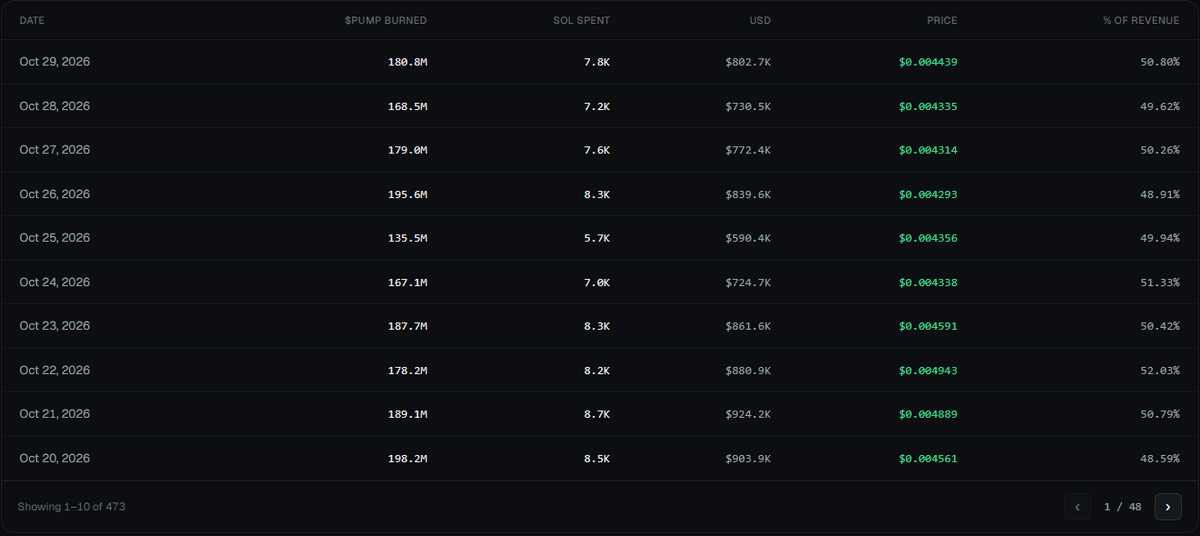
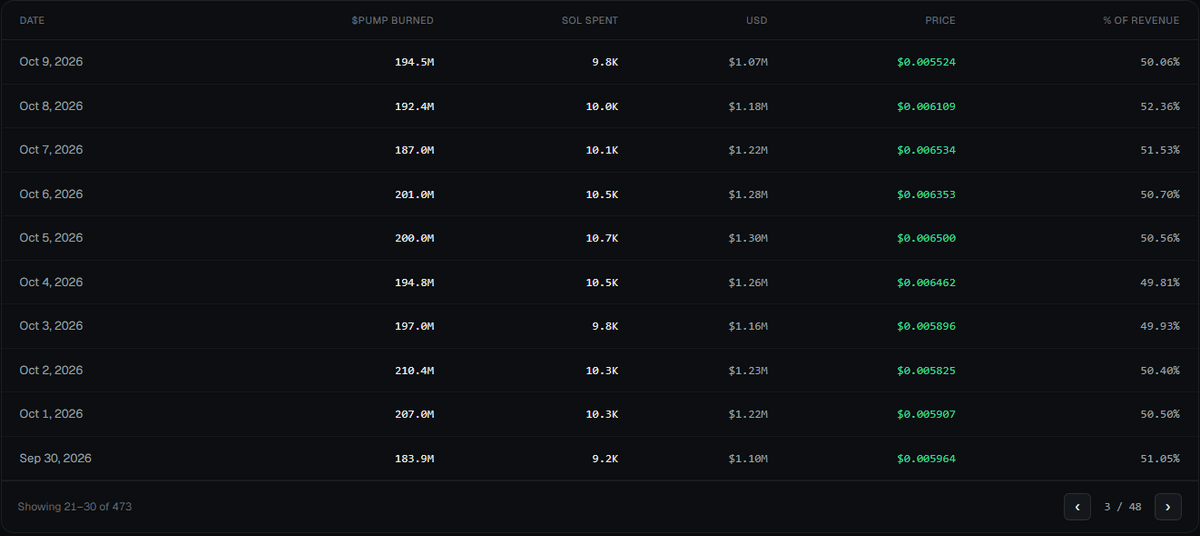
The seven days from 23 to 29 October averaged about $760,000 a day. The first seven days of the month averaged about $1.24 million. Those earlier rows are below.
Why the Pump.fun buyback shrank faster in dollars than in tokens
Two things moved inside the Pump.fun buyback. The number of PUMP burned each day slipped about 13%, from roughly 200 million in the first week of October to roughly 173 million in the last. The price paid for each token fell further, from an average near $0.0062 on those first seven days to near $0.0044 on the last seven.
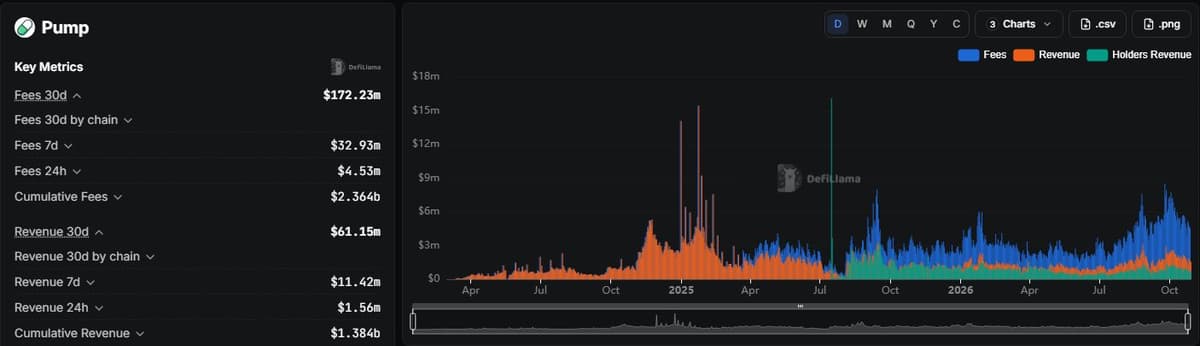
Revenue drives the Pump.fun buyback too. DefiLlama lists Pump.fun revenue at $1.56 million for 29 October and $11.42 million for the latest week, about $1.63 million a day. For 5 October it recorded $2.64 million. Half of $1.56 million is $780,000, close to the $802,700 the burn record shows for 29 October.
PUMP fell with the market on 29 October
PUMP lost 13.0% on 29 October, measured on Binance’s UTC daily candle, while bitcoin lost 4.1%. The sharpest drop came in the hour starting 20:00 UTC. PUMP fell 8.1% in that hour, from $0.004419 to $0.004062, and bitcoin fell 2.5%. It was the evening of the Binance hack, which the exchange put at about $6.3 billion. Renzo’s REZ, after nine days of gains, also pulled back the same day.
Over the last seven days, PUMP and bitcoin have moved almost in step, with a correlation of 0.94 on daily moves (1.0 would mean they rise and fall together every day). Over 30 days it is 0.63. The slide before that is PUMP’s own: three lower highs since early October, at $0.006806 on 4 October, $0.006042 on 12 October and $0.005224 on 21 October. Bitcoin is down about 7% over the same 30 days. PUMP is down 31%.
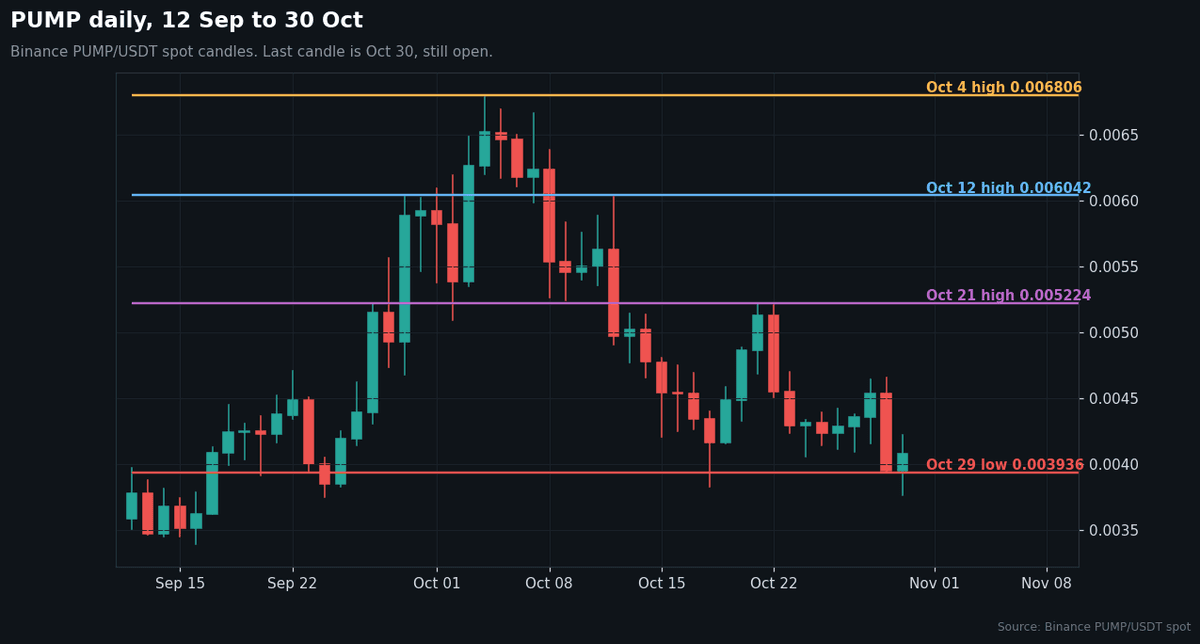
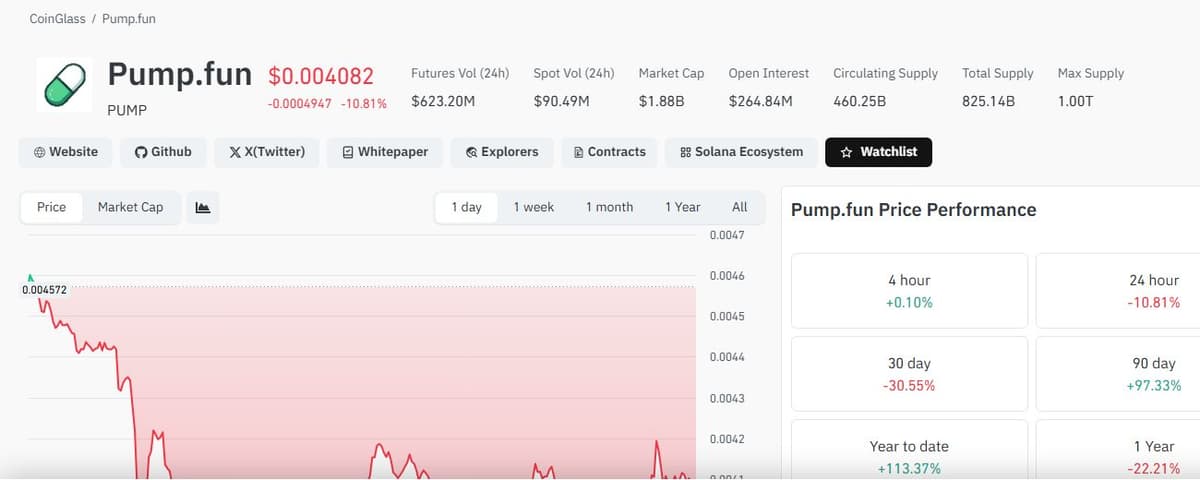
On 30 October PUMP dipped to $0.003762, under the 29 October low, then recovered to about $0.0041. CoinGlass shows $623.20 million of PUMP futures trading in 24 hours against $90.49 million in spot trading, nearly seven times as much, and $264.84 million of open interest, the dollar value of futures positions still open. A day’s Pump.fun buyback of about $0.8 million is under 1% of that spot volume.
PUMP price levels after the drop
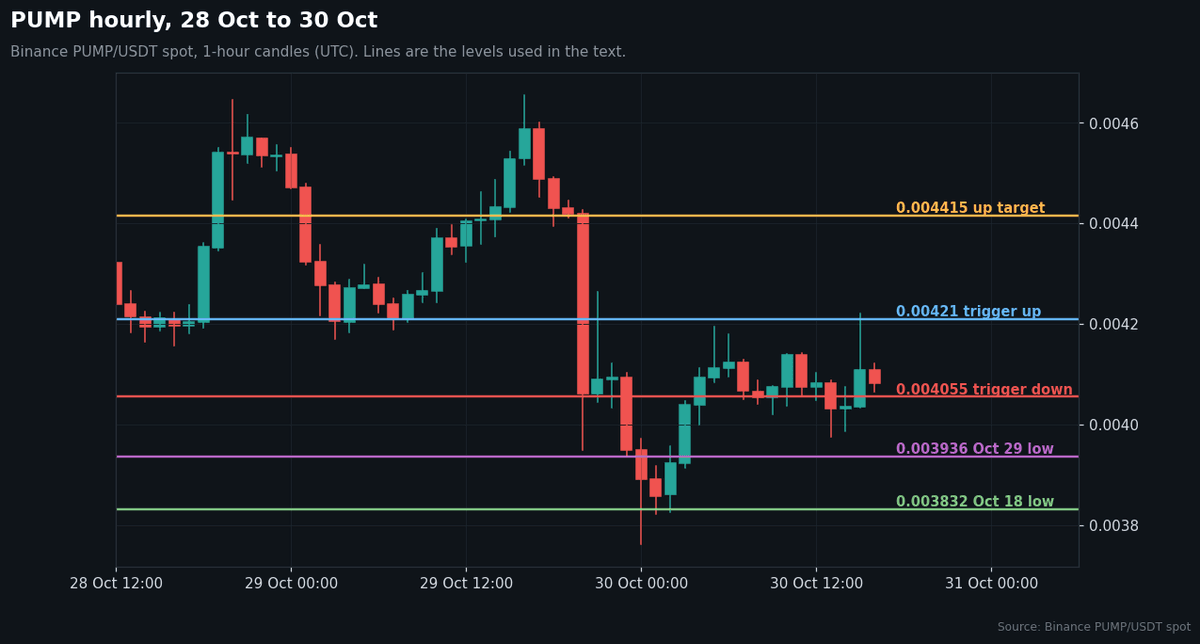
At 16:00 UTC on 30 October PUMP traded at $0.00408 on Binance, between the two levels that decide the next move. Neither side has the edge.
A one-hour close above $0.00421, the 15 October daily low, would point to $0.004415, where four-hour candles stalled on the morning of 28 October. That path stops working on a one-hour close back under $0.004189. Going the other way, a one-hour close under $0.004055, last week’s low, points to $0.003936 and then $0.003832, the lows of 29 and 18 October. A one-hour close back over $0.0040753 cancels it.
The Pump.fun buyback record’s newest row was 29 October when checked on 30 October. The next rows will show whether daily spending holds near $0.8 million.