Bitcoin sat near $77,900 on U.S. election day and shrugged when AMD reported a record quarter after the stock market closed. This Bitcoin midterm day isn’t over, though. Americans are still voting, and AMD shares jumped about 7% once the bell had rung.
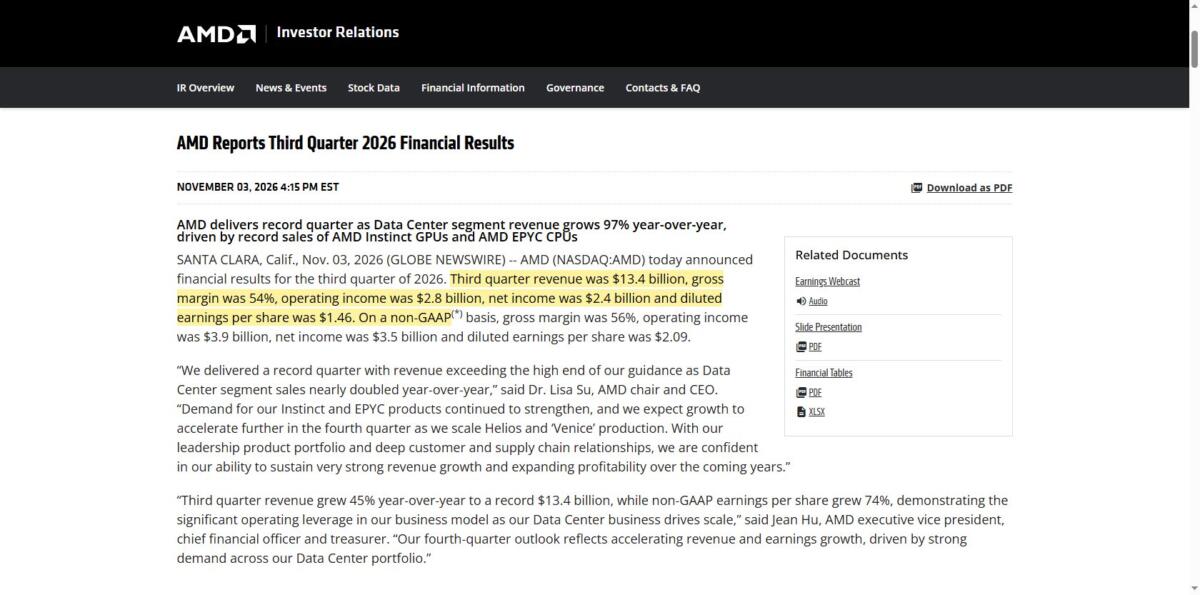
The chipmaker booked $13.4 billion in third-quarter revenue. Management had asked investors to expect about $13 billion, give or take $300 million. So the result cleared even the high end. Profit per share, adjusted, landed at $2.09. For the fourth quarter AMD is aiming at roughly $17 billion.
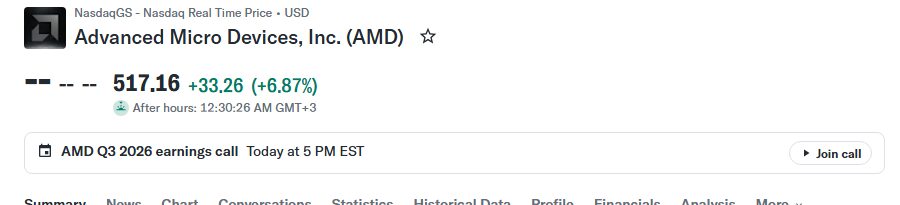
The stock closed at $483.90. After hours, Yahoo Finance had it at $517.16. Bitcoin, meanwhile, was at $77,943 on Binance.
Why AMD’s report matters on Bitcoin midterm day
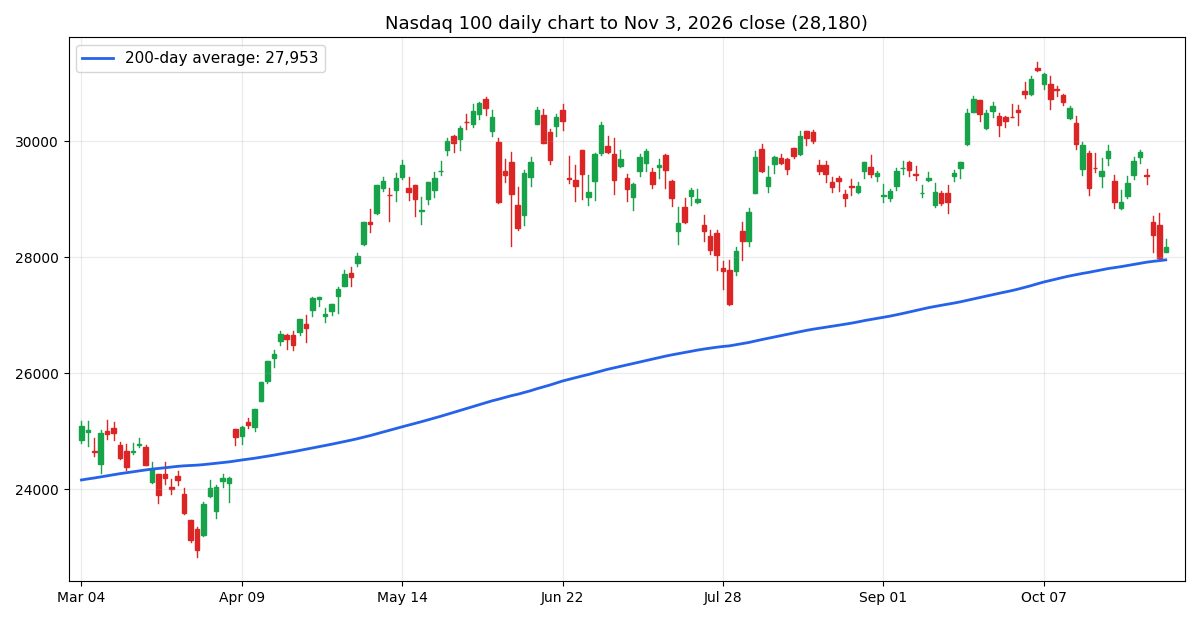
They fell together after 28 October. AMD slid about 19%, from $578.40 to $466.84 by Monday’s close. Over the same stretch the Nasdaq 100 lost 6.1%. Bitcoin lost 5.6%, sliding from $81,343 to $76,816.
Is that a real link? Partly. Over the last 60 trading days, correlation between the two has been 0.44. Perfect lockstep would score 1. No connection at all would score 0. They lean the same direction. They don’t march together.
The Nasdaq 100 ended Tuesday at 28,180. Its 200-day average is 27,953, so the index is hanging just above it. Traders lean on that average to judge whether a market is still trending up. A close below it gets noticed.
AMD beating its own forecast helps the case for a tech rebound. Bitcoin midterm trading stayed quiet in the minutes after the report, so the question stays open until U.S. stocks trade again on Wednesday.
What the Bitcoin midterm vote could change
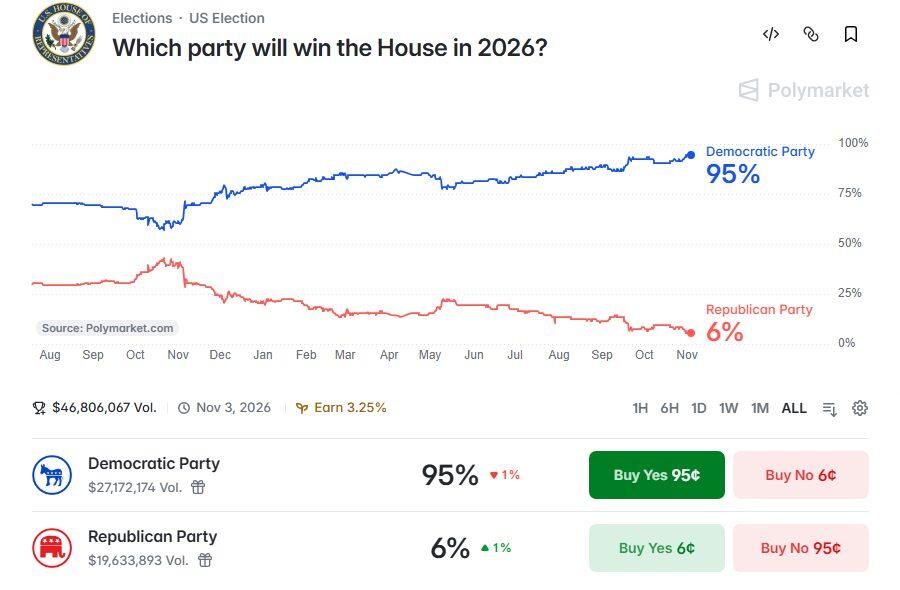
Control of Congress decides which bills reach the president, including any that touch crypto. On Polymarket, traders put the Democratic Party at 95% to win the House on Tuesday, up from about 70% last August. Those are betting odds and not results.
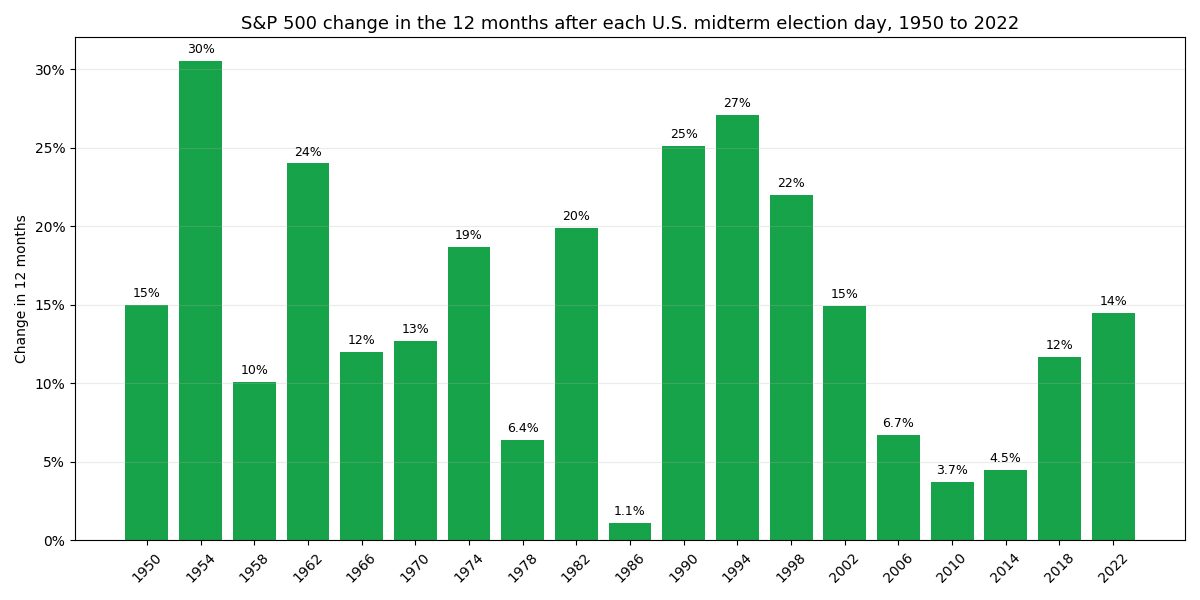
Stocks have a track record here. A year after each of the 19 midterm election days since 1950, the S&P 500 stood higher every time. The smallest gain came in 1986, at 1.1%. The biggest came in 1954, at 30.5%. Bitcoin has only been around for a few of these votes, which makes the pattern a weak guide for it.
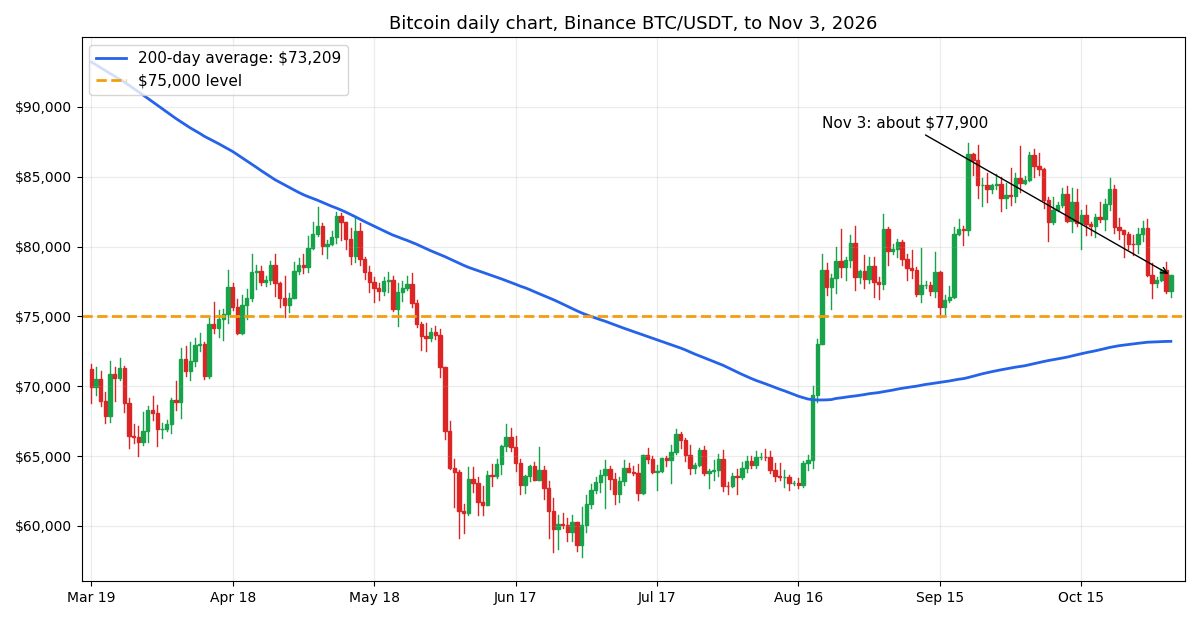
Bitcoin midterm levels: the $75,000 line after the Iran strikes
Then there is Iran. Three U.S. officials told CBS News that the military launched limited, defensive strikes on Qeshm Island on Monday. Iran’s deputy foreign minister, Kazem Gharibabadi, said Tehran keeps the right to defend itself. President Donald Trump has said a deal “could happen”. He also said “we still have to take care of” several sites in the country.

The Bitcoin midterm picture on the chart is simple. Bitcoin has not finished a single day under $75,000 since 20 August. Look at the chart and the reason is plain. Price turned around near that number in mid-March, mid-April, late May and mid-September. The 200-day average sits lower, at $73,209, so a close under $75,000 would put that line about $1,800 away.
The numbers above come from AMD’s results release, Yahoo Finance, Polymarket, CBS News and Binance price data.