Bitcoin burst through $80,000 on Wednesday in a Bitcoin short squeeze, a day after U.S. midterm voting that handed Democrats both the House and the Senate, the Associated Press reported.
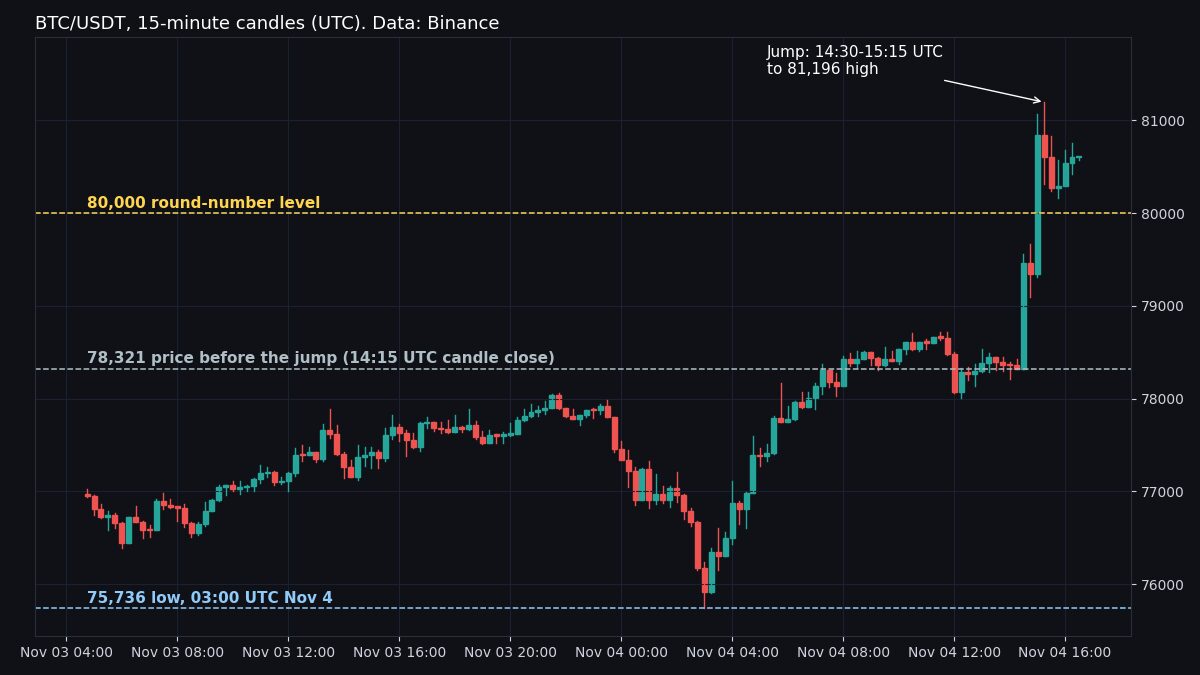
The price sat at $78,321 at 14:30 UTC. Within an hour it hit $81,196, up 3.7%, on Binance. The overnight low was $75,736. At 16:15 UTC the price stood near $80,400.
How a Bitcoin short squeeze works
Short sellers bet on a fall. They borrow coins and sell them, then need a lower price to buy back cheaper. A rise hurts them, and once losses pile up the exchange closes the trade for them. That forced close is itself a purchase, which feeds the climb.
Per the AP, Democrats took both chambers. Speaker Mike Johnson won’t seek re-election as House GOP leader, an AP source said, and President Donald Trump struck a conciliatory tone while warning of vetoes.
How much money traders lost
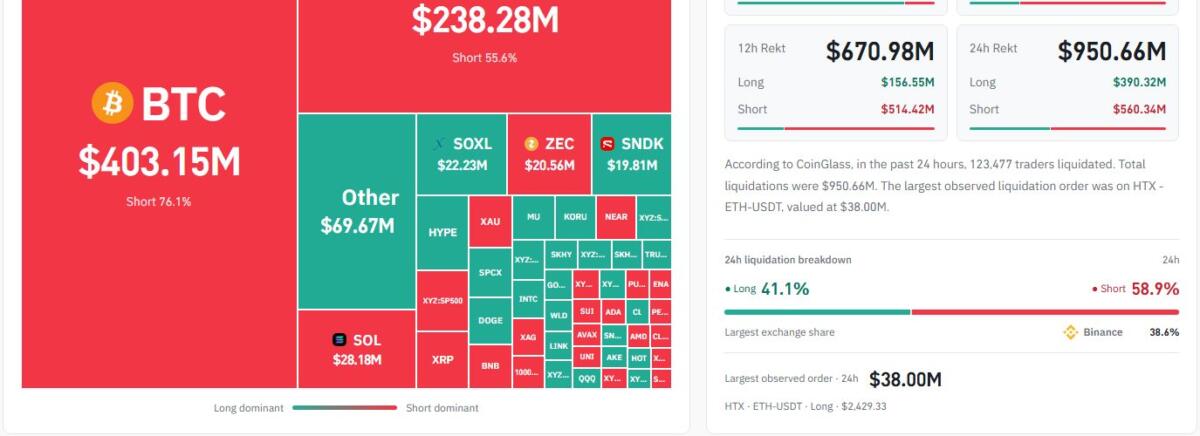
CoinGlass, which tracks forced closings across exchanges, counted $950.66 million in liquidations over the 24 hours to Wednesday afternoon. Short positions made up $560.34 million of that, or 58.9%, and long positions $390.32 million. The longs were hit during the overnight drop toward $75,736.
The Bitcoin short squeeze hit hardest in BTC itself. Bitcoin alone accounted for $403.15 million, and 76.1% of it was shorts. Binance had the largest share of the day’s total at 38.6%.
After the Bitcoin short squeeze: levels to clear next
Before Wednesday, Bitcoin had closed between $76,816 and $78,354 on each of the previous six days. Today’s move took it out of that range. The daily candle is still open, so the close at 00:00 UTC decides whether the squeeze holds.
The nearest line above is the 50-day average, the mean of the past 50 daily closes, at about $82,070. The 200-day average, at about $73,230, is the line below the overnight low. A fall back under $80,000 would put the 75,736 low in play again, and a break of it would leave the 200-day average as the next marker.
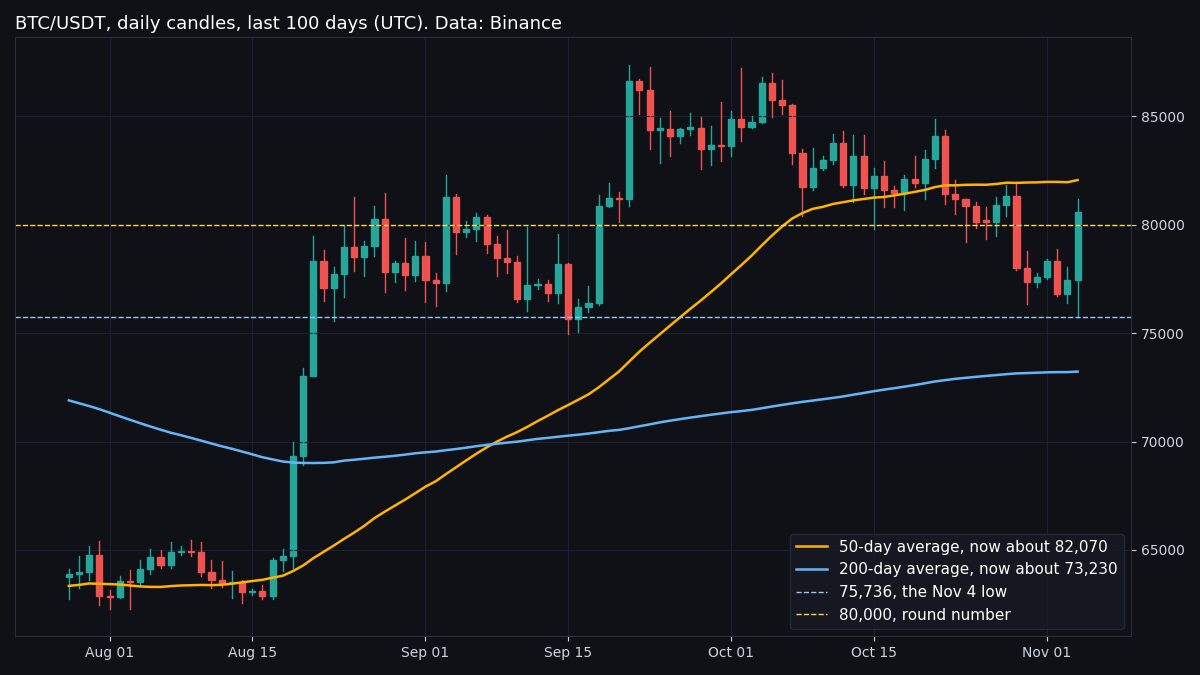
The midterm-day report flagged the $75,000 area on Tuesday. The overnight low came within $736 of it.