Thursday’s session at Binance printed a low of $79,800 on the Bitcoin price, at 13:55 UTC. That was an hour and a half after producer prices posted their biggest monthly gain since March 2022. Wednesday had already cost BTC a couple of grand once consumer inflation landed at 3.7%. Right now it’s back around $82,000.
Two hot reports landed within 24 hours. Price dipped after both and recovered part of the loss each time.
A 3.7% CPI Print and the Bitcoin Price Reaction
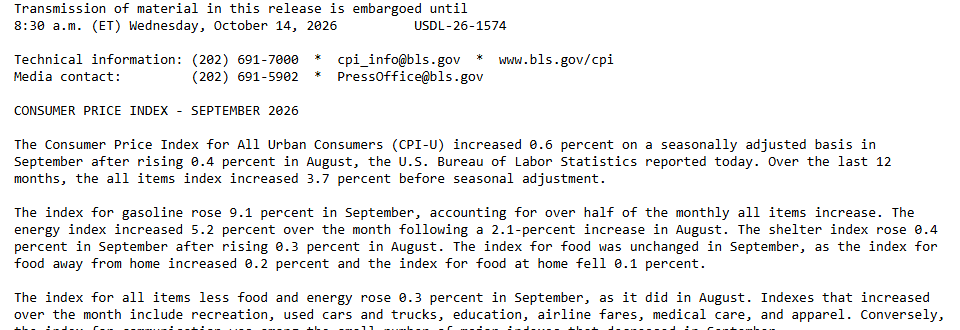
September’s all items index climbed 0.6%, per the BLS, which followed a 0.4% gain in August. Year on year that makes 3.7%, where August’s report had said 3.4%.
Pump prices did the heavy lifting. Gasoline alone rose 9.1% on the month, over half the headline gain. Against a year ago, energy is up 20.4% and gasoline is up 34.2%. Take food and energy out and September rose just 0.3%, the same pace as August, good for 2.6% annually.
The minute before the 12:30 UTC release, Binance had BTC at $83,860. Sellers took it down to $81,589 by 15:58 UTC, roughly 2.7% lower, and the daily candle shut at $81,682.
PPI Followed With the Biggest Monthly Jump Since 2022
The next morning the producer report showed final demand prices up 1.3% in September, after 0.5% in August. The BLS calls it the largest advance since the 1.7% rise of March 2022. The 12-month rate is 6.3%, the highest since December 2022.
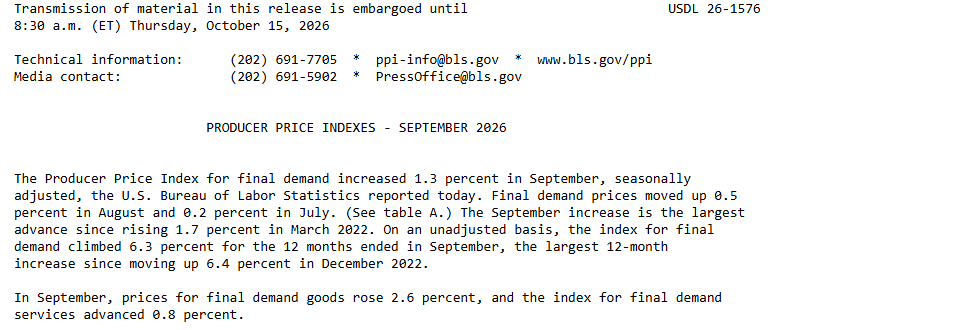
Final demand goods rose 2.6%, the biggest increase since the series began in December 2009. More than 80% of that rise came from energy, which jumped 10.8%, and gasoline alone climbed 20.3%. Prices for final demand less foods, energy and trade services rose 0.5% on the month and 5.0% on the year.
The Bitcoin price stood at $81,076 a minute before the print. That low of $79,800 arrived 85 minutes later, about 1.6% below the pre-print level. By 15:41 UTC buyers had pushed it up to $82,631 anyway.
Fed Hike Odds Barely Moved the Bitcoin Price
CME’s FedWatch tool, read at 11:31 a.m. Central on Thursday, put the chance of a 25 basis point hike at the October 28 meeting at 29.3%. The odds of no change sat at 70.7%, with the target range at 3.75% to 4.00%.
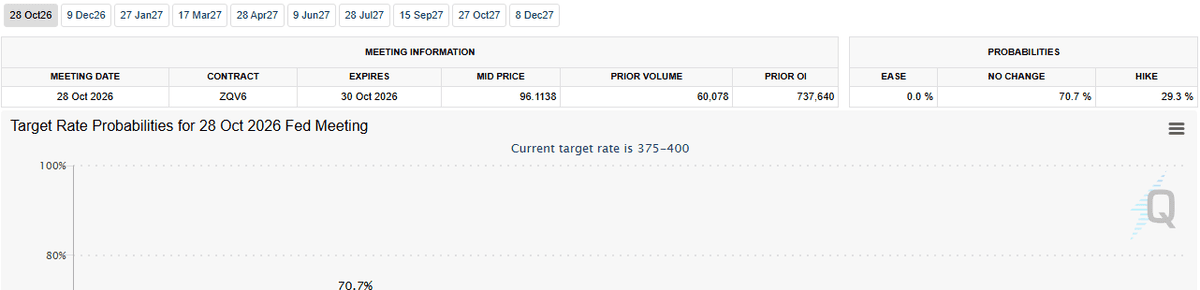
The same table shows 33.2% for a hike one day earlier and 17.7% one week earlier. So the odds are far above last week’s reading but a little lower than after the CPI print. Producer prices posted their biggest monthly gain in over four years, yet the hike odds slipped from the day before instead of climbing.
$930 Million in Liquidations Hit Longs Hardest
Coinglass lists $930.35 million of liquidations across all coins in 24 hours. Longs made up $779.20 million of it, about 84%, against $151.15 million of shorts. A total of 173,451 traders were liquidated, and the largest single order was a $12.03 million BTCUSDT position on Binance.
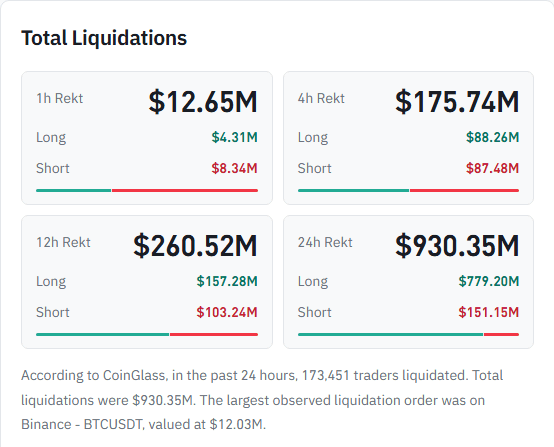
The Bitcoin price was not the only thing under pressure, since ether took the biggest share of the heat-map with $287.36 million.
Spot ETFs Sold Into the Dip on Wednesday
Farside’s table has US spot Bitcoin ETFs shedding $261.4 million on October 14. FBTC accounted for $152.7 million of that and IBIT for $110.9 million. The day before, funds had taken in $175.7 million, and October 12 was a $65.4 million outflow. Add the three up and it’s $151.1 million leaving.

The Bitcoin Price Chart and the 200-Day Line
On Binance’s daily BTC/USDT chart the Bitcoin price hovers near $82,000. The 200-day simple moving average is at $72,323, which leaves roughly 12% of air between them. The average turned up in August and has climbed since, but price rose faster, which is why the gap is so wide.
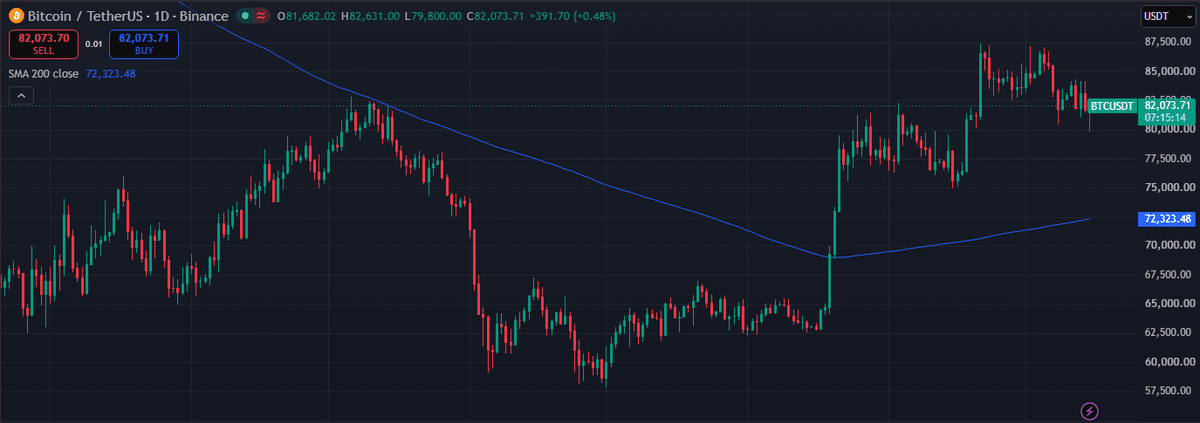
The 50-week average of weekly closes on the same pair is near $76,587. Daily RSI reads around 48, a neutral level, after the September 21 high of $87,396 on Binance.
Watch $79,800 first, since that’s today’s low. A daily close under it puts the 50-week average in play, with the 200-day line about 9% further down. Going the other way, $84,168 (the October 13 high) is the ceiling of the post-CPI range, and a close over it would clear the lot.
For earlier context, the week-ahead look at the CPI setup flagged the same ETF outflow pattern. Related price reads include the ETH setup after nine outflow days and today’s ZK move. The Fed meets October 28. October’s CPI follows on November 10.