Stellar’s XLM just printed one of the sharpest weekly candles in recent memory. A 40% gain in a single week puts it back on screens. But right where the move stops is exactly where it gets complicated.
The rally came off hard news. DTCC and the Stellar Development Foundation announced on May 27, 2026 plans to connect DTC’s tokenization service with the Stellar public blockchain, targeting a launch in the first half of 2027. The Depository Trust and Clearing Corporation said the collaboration forms part of a broader multi-chain strategy for tokenized real-world assets, including equities, ETFs, and Treasuries.
Trading volume hit $308.85 million in 24 hours per CryptoRank data from May 28, a 244% jump from the sessions before the announcement. XLM decoupled from the broader market, even as Bitcoin dropped under $73,000 that same day.
Where the Chart Actually Sits Right Now
Price has now pressed into the 50-week EMA sitting around $0.22. That level hasn’t been tested since October 2025. Technical analyst ChartNerdTA, writing on X, called the weekly candle well-deserved on the DTCC news but flagged that resistance ahead.
“What a beautiful 40% weekly candle print on $XLM; and well deserved on the recent DTCC news! Now lets talk technical. During this window of relief, price has pressed into the 50 week EMA ($0.22) for the first time since Oct 2025. I expect rejection here with $0.16 support below.”
Source: ChartNerdTA on X
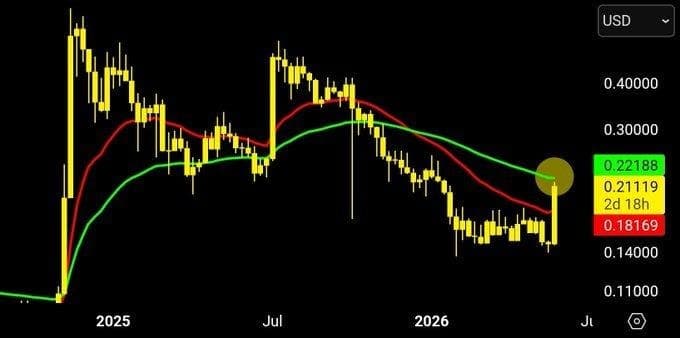
XLM weekly chart showing price pressing into the 50-week EMA at $0.22. Source: ChartNerdTA / X
That is not a sell signal on its own. But the 50-week EMA rejections tend to be sticky, especially when a token has spent several months below it. XLM traded between roughly $0.14 and $0.17 for most of early 2026 before this week’s move. A rally that almost doubles the recent range in one candle needs volume confirmation to hold.
ChartNerdTA went further in a follow-up post on X, adding historical precedent to the rejection call. The last time XLM broke through the 20-week EMA and shot toward the 50-week EMA, the move ended the same way.
“For added context: during $XLM’s last bear market, when price broke through the 20 EMA and shot towards the 50 EMA, it got rejected and retraced 37%.”
Source: ChartNerdTA on X
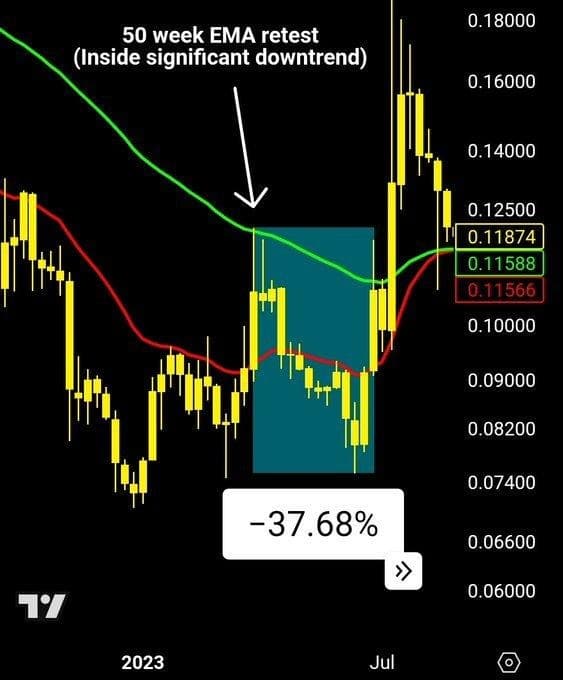
XLM 2023: the last 50-week EMA rejection inside a downtrend produced a 37.68% retrace. Source: ChartNerdTA / X
That 2023 episode saw price shed 37.68% after tagging the 50-week EMA while still inside a broader downtrend. The setup then and now share one feature: both moves came off a sharp spike through a short-term average, running straight into the longer-term resistance before the structure was ready to hold it. History doesn’t repeat cleanly but the pattern is hard to ignore.
The answer isn’t coming this week. It comes over the next few months.
The Range ChartNerdTA Is Watching
In a separate post, ChartNerdTA laid out a wider picture for where XLM sits in the current cycle. The call isn’t bullish or bearish in isolation. It’s measured.
“$XLM will likely range between $0.23/$0.10 over the next few months. I expect a cycle low to build between the red upper regression band, and the green middle regression band before macro expansion (3-month timeframe).”
Source: ChartNerdTA on X
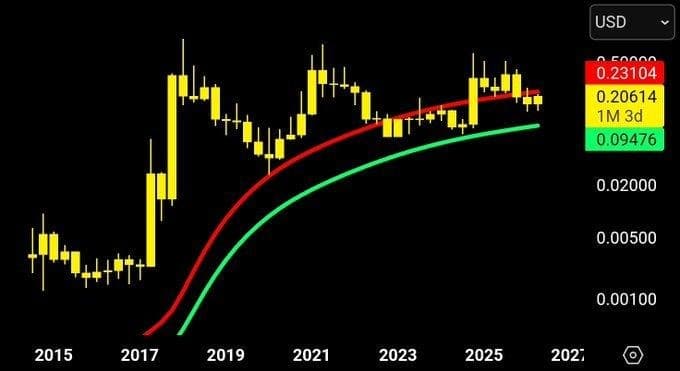
XLM macro chart showing the regression band levels that define the expected ranging zone. Source: ChartNerdTA / X
For a retail XLM holder watching this week’s spike, that framing matters. The $0.10 floor ChartNerdTA references represents a scenario where the DTCC-driven excitement fades and price builds a proper base before any macro expansion. The $0.23 ceiling sits just above current levels. So the rally may have already done most of what it’s going to do in this leg.
That’s not a collapse call. It’s a ranging call. Those two things are different, but easy to confuse when a 40% weekly candle just printed.
What the DTCC Deal Actually Changes
The Dec 2025 No-Action Letter from the SEC allowed DTC to implement a tokenization service for DTC-custodied assets. What gets attached to Stellar is not a speculative side project. Tokenized assets on Stellar, according to the DTCC statement, carry the same investor protections and safeguards as traditionally held securities.
Stellar already has working relationships with MoneyGram, Circle, and Visa. The DTCC collaboration adds a layer those partnerships couldn’t: direct access to the infrastructure that clears and settles most of the US securities market. That’s real, but it doesn’t close in 2026. The live service targets H1 2027.
Between now and then, XLM trades on the expectation. That gap between announcement and delivery is exactly where ranging behavior lives.
The $0.16 Floor and Why It Matters
If rejection happens at the 50-week EMA, ChartNerdTA points to $0.16 as the next support level to hold. BanklessTimes data from May 28 shows 10 out of 12 tracked moving averages still signaling buy, with the EMA200 at $0.1963 and SMA200 at $0.1906 sitting as sell signals above current price.
That means the recovery from $0.16 would need to clear those two longer-term averages before anyone can call the structure fixed. For an East African trader watching XLM as a payments play tied to cross-border remittance corridors, those averages represent real gatekeeping levels for a sustained trend shift.
Stablecoin transfer volume on Stellar hit $3.29 billion over the past 30 days, up 16% per BanklessTimes data from May 28. That is background adoption. It doesn’t move the chart this week, but it matters for whether $0.16 holds as a base if price pulls back.
The Risk Case Nobody Is Talking About
Every coverage of this story leads with the DTCC deal as a catalyst. Most stop there. What they’re not saying is that the window for executing this announcement is a year out, and a lot can change in twelve months for a blockchain with a low-authority domain authority trying to scale institutional adoption.
ChartNerdTA’s reading is the cleaner one. Expect rejection at the 50-week EMA. Watch $0.16 below. If a cycle low builds between the regression bands over the next three months, that’s where the base gets made. The macro expansion he references doesn’t happen at $0.22. It happens from wherever that base lands.
Timing a DTCC story is not the same as trading a confirmed trend. That is the distinction worth keeping in mind before the next weekly candle closes.