XRP swept below the $1.30 level on Wednesday and is now searching for its lowest daily candle close since early February. The token was changing hands at $1.29 at the time of writing, down roughly 5% over 24 hours.
Most holders are underwater. The crowd is selling. Not everyone is.
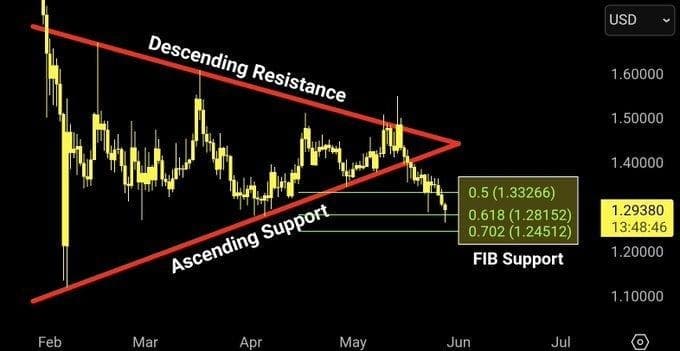
Chart: XRP descending wedge with FIB support levels at $1.28 / $1.24. Source: ChartNerdTA on X.
The Levels Nobody Is Talking About
As ChartNerdTA posted on X, FIB support currently sits between $1.28 and $1.24. That band has to hold.
> “$XRP has swept below the $1.30 guardrail and is now searching for the lowest daily candle close since early February. Current FIB support rests between $1.28/$1.24. It’s got to hold, or the $1 potential opens up sooner rather than later.”
If that level breaks, $1.00 becomes a real conversation. ChartNerdTA did not dress that up. The $1 target would represent a fresh leg down from already-beaten levels.
What makes this setup different is the time context. XRP traded near $3.65 in July 2025. It is now sitting nearly 65% off that peak. A retail XRP holder who bought anywhere above $2 last year is sitting on a significant unrealized loss, and that is exactly the kind of environment where patience runs out fastest.
Where the Patient Money Is Sitting
Technical analyst CryptoPatel laid out a full accumulation map on X while the broader community turned bearish. His first entry zone, spanning $1.00 to $1.20, has already been filled. The second sits between $0.85 and $0.70. A third deeper zone, from $0.65 down to $0.50, is what he described as “a gift” — placed and waiting.
> “Everyone is bearish right now at $1.28. Me? I am calm and getting ready to load more.”
Long-term price targets from CryptoPatel stand at $3, $7, and $10. A move to $10 from the current price would represent roughly a 15x return from the $0.65-$0.50 accumulation zone. He was direct that these are not short-term calls.
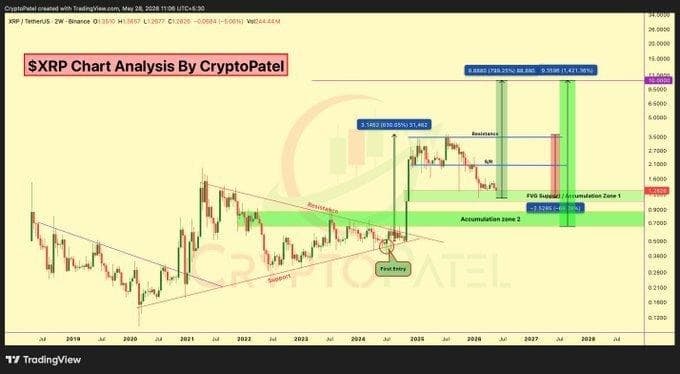
Chart: CryptoPatel’s long-term XRP accumulation zones and price targets up to $10. Source: CryptoPatel on X.
The distinction matters. Short-term noise and a multi-year accumulation thesis operate on completely different clocks. That is the tension right now between what the chart looks like today and what some technical analysts believe the chart is building toward.
The Pattern in the Wedge
The first chart shows XRP forming a descending wedge structure, with a descending resistance line pressing down from above and an ascending support line holding from below. The FIB levels cut across that range: 0.5 at $1.33, 0.618 at $1.28, and 0.702 at $1.24.
Price was at $1.293 at the time of publication, sitting directly on the 0.618 FIB. That is not a coincidence. It is the level technicians watch. A sustained close below $1.24 would change the picture considerably for near-term traders.
On-chain data from Coinglass as of May 28, 2026 shows XRP open interest remains elevated despite the pullback, suggesting futures positioning has not fully unwound. That either means more pain ahead if longs flush out, or a coiled setup if price stabilizes at current FIB support.
The Case That Does Not Hold
Not every read on XRP right now is bullish. The accumulation thesis only works if holders have the time and liquidity to ride through further downside. A break below $1.24 with volume would invalidate the near-term wedge support and push the conversation toward $1.00 faster than most holders are prepared for.
Bobby Singh, derivatives analyst at Capriole Investments, noted that assets sitting on FIB confluence zones without a macro catalyst behind them tend to slice through rather than bounce. XRP does not yet have a confirmed fundamental trigger at the time of writing.
The CLARITY Act, which could reduce legal uncertainty around XRP’s commodity classification in the United States, remains in the Senate. If that vote stalls past July, the chart support at $1.24 faces a harder test with less underneath it.
What the Long Game Actually Looks Like
The second chart from CryptoPatel plots XRP’s full 2-week structure going back to 2018. It shows the current price near the base of a long consolidation base, with the accumulation zone labeled from $0.70 down to $0.50. Above that sits the FVG support band between roughly $0.85 and $0.70.
His projections show a first major target at 5.3482, a second near 8.8880, and a final level close to 9.5598 on that scale. The math on those targets from a $0.65 entry would produce the 15x return he referenced. The timeline is not stated as months. It is a long position.
A Kenyan crypto trader sitting on XRP bought in 2024 faces a specific decision here: whether the time horizon on those targets is realistic given personal liquidity needs. That is the real-world version of this chart. Patterns do not pay rent.
Still, the structure CryptoPatel is mapping has a logic to it that the weekly chart supports. The prior accumulation base before XRP ran from $0.50 to $3.65 looked very similar.