A trader posting under the handle Arya described, in her own words, hunting Unibase longs twice in one overnight session. Hours after she posted it, $UB gave back nearly its entire week-long rally in a single day, down roughly 20 percent.
The chart’s shape matches what she wrote almost exactly. That’s the part worth sitting with.
A Week Of Rallies Set The Trap
Unibase, an AI agent memory-layer project trading on BNB Chain, spent the back half of July climbing out of a summer low near 10 cents. CoinGecko’s own insight feed logged the climb in real time: a 17 percent move credited to “strong market structure,” a 25 percent rally, an 11 percent push tied to rising open interest, a 15.83 percent jump after an AI agent ranking. Each one read as organic momentum on its own. Stacked together over roughly a week, they carried UB from about 10 cents to an intraday spike near 20.8 cents.
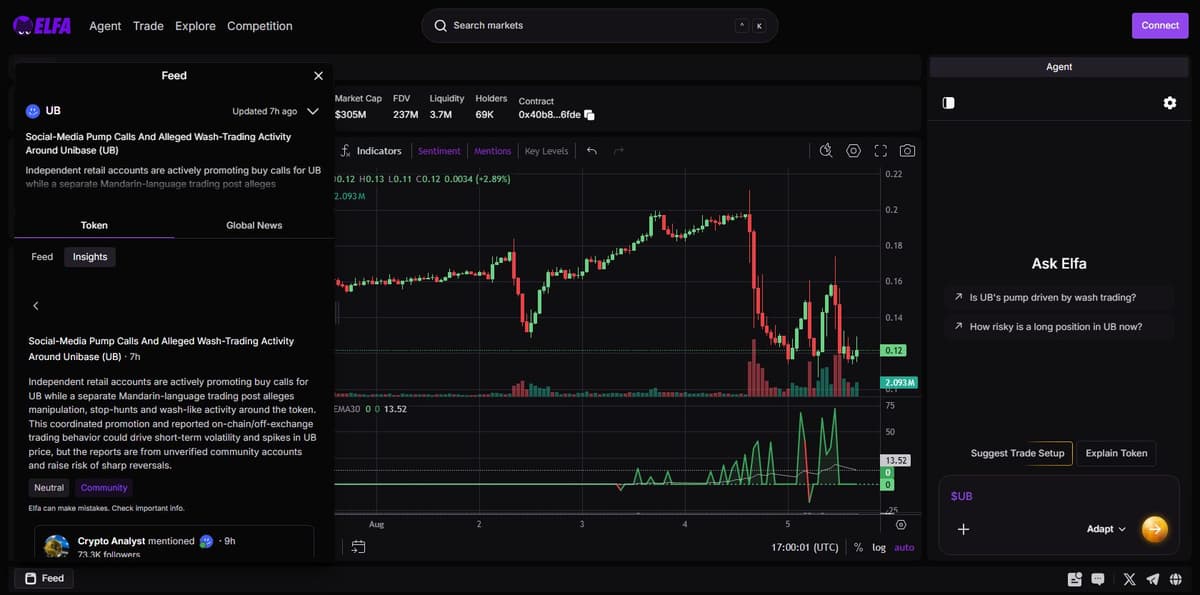
Then, today, CoinGecko’s feed logged something different: “Social-Media Pump Calls And Alleged Wash-Trading Activity Around Unibase.” The source was Elfa AI, an on-chain social analytics tool, and it flagged two accounts by name.
One Trader Named The Mechanism
The first, an account called Crypto Analyst with 73,300 followers, posted “$ub will pump hard soon. Buy now.” roughly nine hours before the crash. That post has since been deleted from X.
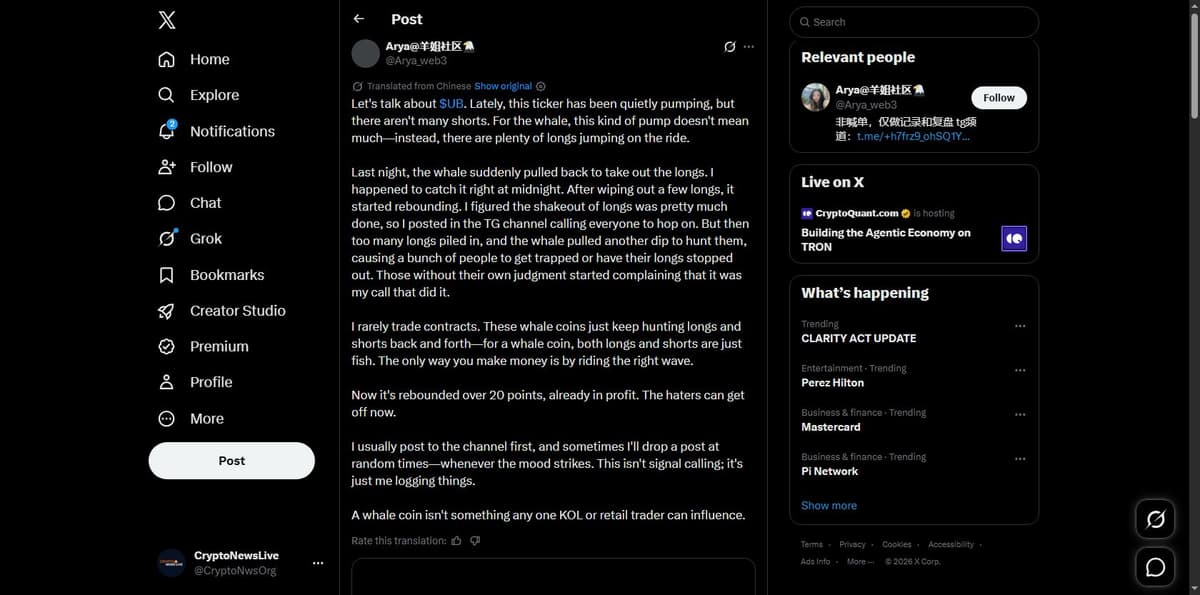
The second is where the story actually lives. Arya, running a community account with 41,600 followers, posted at 12:27 PM UTC today, in Chinese, later auto-translated by X itself. She described UB as a “whale coin,” her term for a token one large holder can move at will. Longs had been piling onto the quiet pump, she wrote, so overnight the whale pulled back hard to wipe them out. She caught the move at midnight, watched it rebound, judged the flush was over, and posted in her Telegram channel calling followers to get in. Too many longs followed. The whale dumped again to hunt that second wave too, she wrote, adding that people without their own judgment were now blaming her for the losses.
The Chart Backs Up The Story
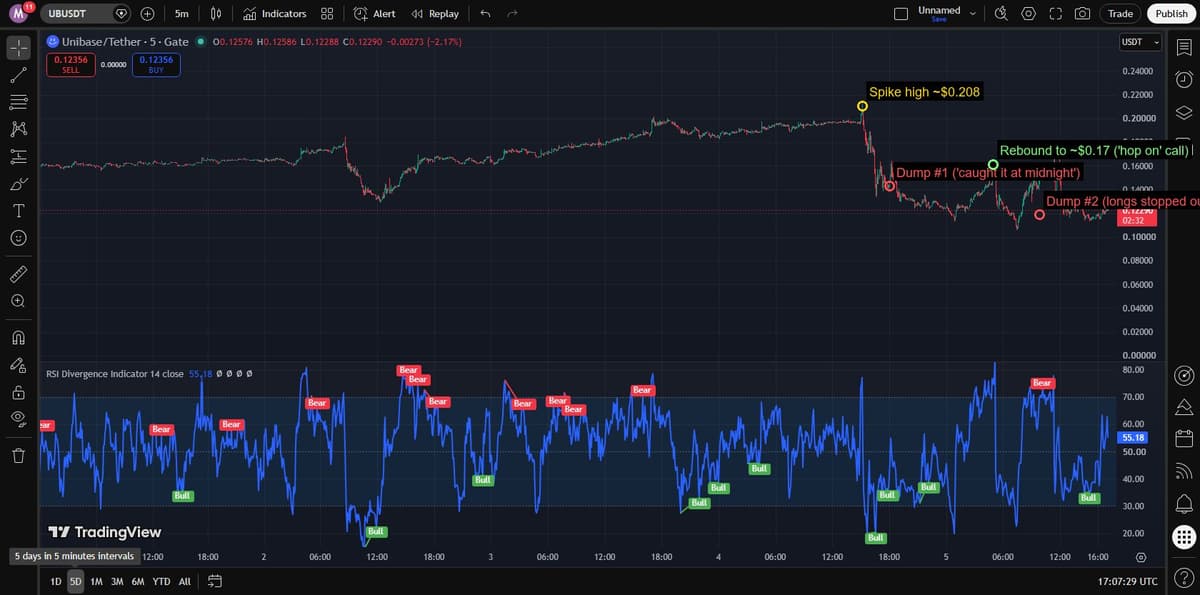
Elfa’s own writeup was careful to call the reports unverified. So the chart itself is the better witness. Pulling UB/USDT on a five-minute resolution shows a spike to about 20.8 cents, a sharp drop to roughly 14.5 cents, a rebound to near 17 cents, and a second sharp drop down to the current 12.2 cents. Two dumps. One rebound sandwiched between them. That is the exact shape Arya described, independently visible in the price data with no need to take her account on faith.
Leverage, Not Spot, Is Doing The Work
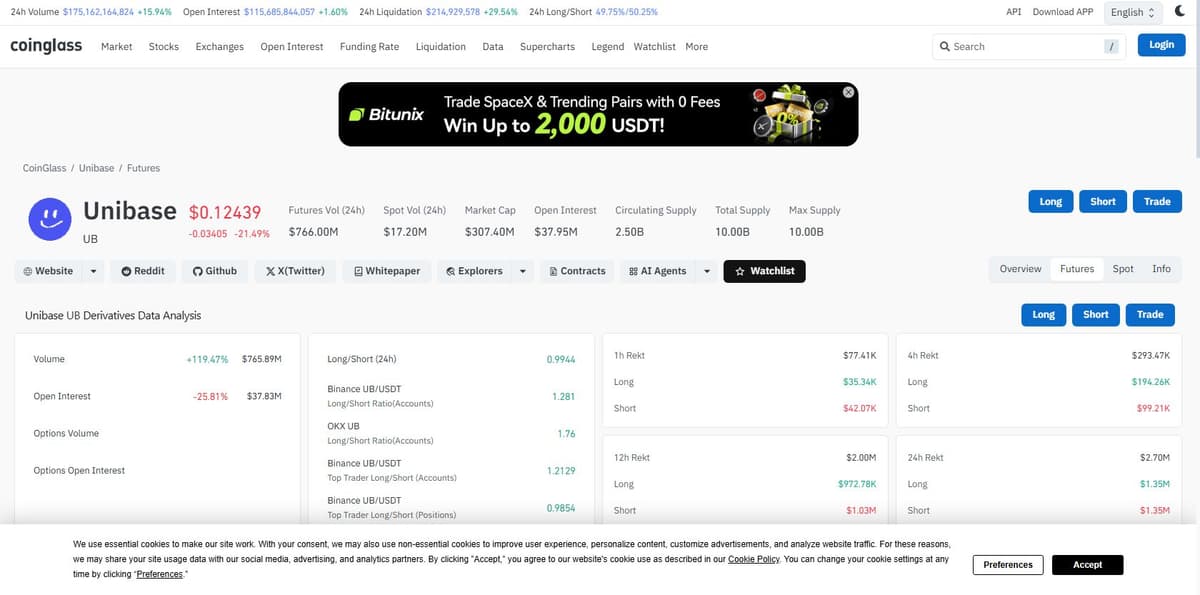
Coinglass shows why a move like this is even possible. Futures volume over 24 hours hit 766 million dollars against just 17.2 million in spot volume, a 44-to-1 tilt. Open interest fell 25.81 percent as the move unwound, and liquidations over the past four hours skewed toward longs, 194,000 dollars against 99,000 on the short side. Retail positioning stayed long-heavy through the drop too: Binance accounts ran 1.28-to-1 long, OKX 1.76-to-1. A market this thin on spot and this loaded with leveraged longs is close to a textbook setup for exactly the kind of stop-hunt Arya described, whether or not a single actor coordinated it on purpose.
Three Wallets Hold More Than Half The Supply
BscScan independently confirms the structural risk Elfa’s insight only gestured at. The top 10 wallets hold 75.12 percent of UB’s 10 billion max supply, and the top 100 hold 92.99 percent, a Gini score of 0.9992. Three unlabeled wallets alone account for 56 percent of the entire supply: 29.36, 18.79, and 7.93 percent respectively. That is precisely the kind of concentration that makes a single actor able to move price the way Arya’s post describes.
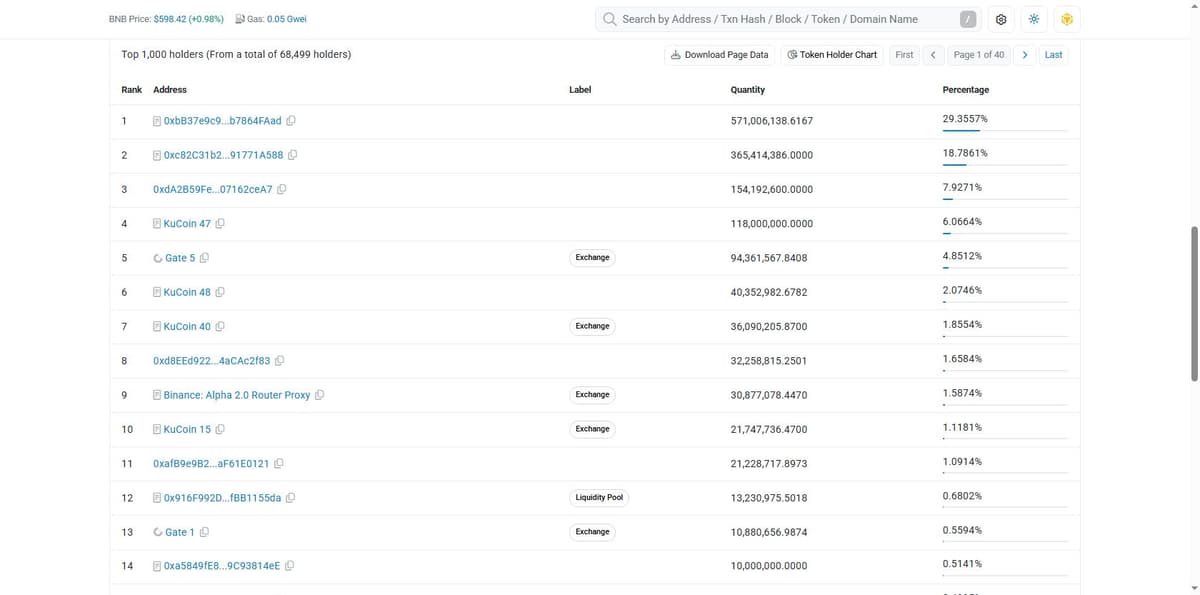
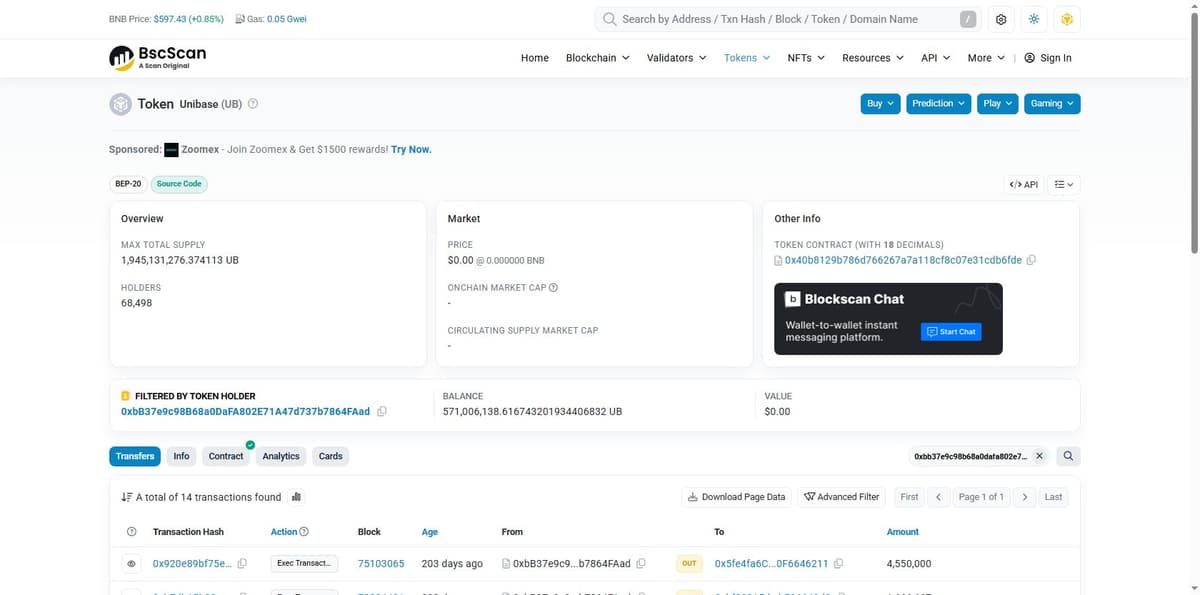
Checking those wallets directly complicates a clean story, though. The largest, holding 29.36 percent, last moved tokens 203 days ago. The second largest, at 18.79 percent, last moved two days ago, and that was an inbound transfer, not a sale. Neither has touched the chain today. Whatever drove the double dump, it isn’t a single traceable wallet spot-selling into the market. The concentration is real. The specific hand behind today’s move isn’t visible on-chain, which points back toward the derivatives market as the more likely engine.
Spot trading itself leans decentralized for what little of it there is. PancakeSwap’s UB/USDC pool alone clears 53.52 percent of reported spot volume, ahead of Gate at 15.21 percent and KuCoin at 11.09 percent. But spot volume in total is a rounding error next to the 766 million dollars moving through futures.
This isn’t UB’s first violent swing. CoinGecko’s own history shows a 45 percent surge that immediately raised holder-distribution concerns 43 days ago, followed by a 30 percent decline three days after that. The pattern Arya described isn’t a one-off. Whether today repeats that cycle or marks the end of this particular run isn’t something the chart or the chain can answer yet.