Where is DOGE right now? Any Dogecoin price analysis for Friday 23 October 2026 starts there. Binance spot had it at 0.0803 around 11:00 UTC. Thursday it closed at 0.07882. So DOGE has given back about two thirds of the Aug 1 to Sep 22 rally, and two Fibonacci lines box it in, 0.0823 over its head and 0.0758 under its feet.
Everything here comes from Binance candles pulled the same morning. Each level carries its date, and live numbers are marked “as of” because they change by the hour.
Dogecoin price analysis on the daily chart: three lower highs and a sweep
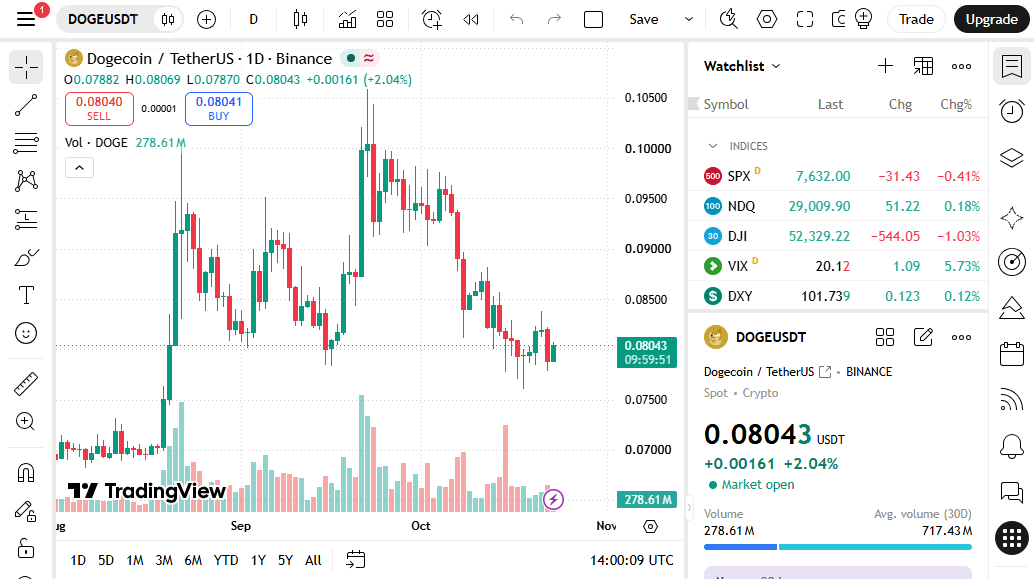
Zoom to the daily chart and the Dogecoin price sequence is clean. Tuesday 22 September gave a swing high of 0.1059. Wednesday 30 September, 0.0982. Monday 12 October, 0.0881. Then Wednesday 21 October topped out at 0.0838. Each rally ended lower than the one before.
Lows tell it differently. Sunday 18 October printed a daily low of 0.07607, under the 16 September swing low of 0.07831. The day still closed at 0.07944, back above it. Price went under an old low and came back inside the same day. That’s what a liquidity sweep looks like on a chart, and it describes what happened. It isn’t a forecast.
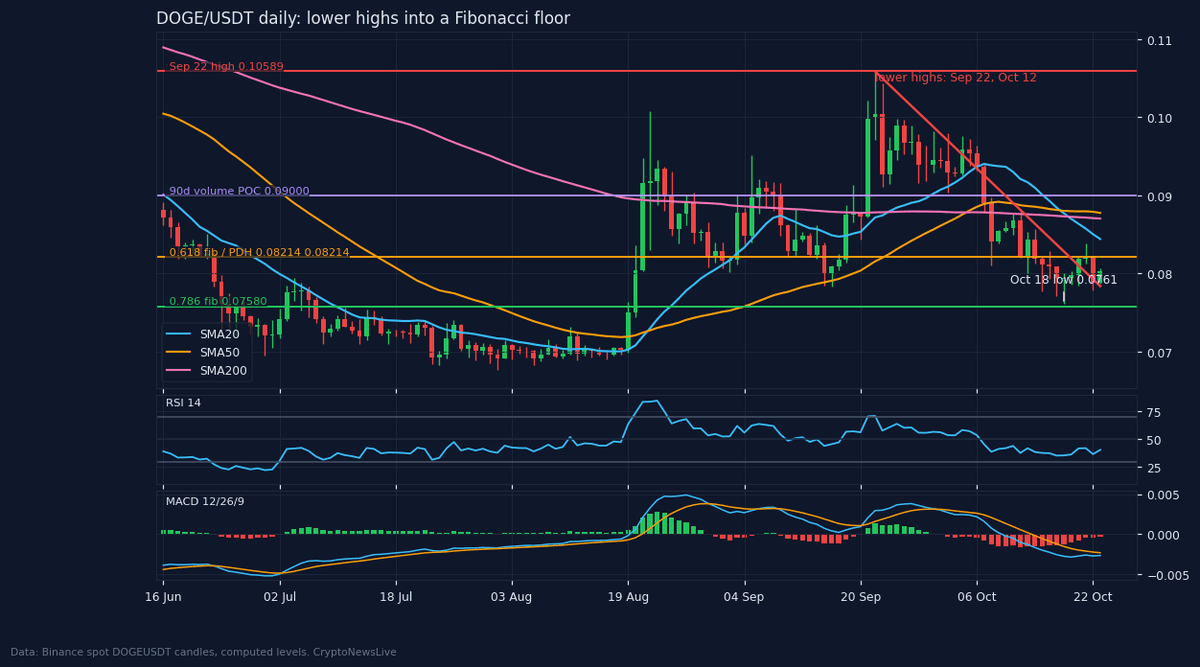
The moving averages are crowded and mostly overhead. The 20-day is at 0.0844 and the 50-day at 0.0878, and the 200-day (0.0870) is overhead too. That’s as of the 23 Oct daily candle. Only the 100-day, at 0.0816, is near price. Daily RSI reads 40.5. The MACD line is under its signal line and the histogram is still red.
The TradingView daily chart shows the same path with no overlays, and the three lower highs are easy to count by eye, from 0.1059 down to 0.0838.
Dogecoin Labs and the price: what the clock shows
On Wednesday 21 October at 07:45 ET (11:45 UTC) a Dogecoin Labs press release announced a new organization led by CEO Jordan Jefferson. It will own and operate MyDoge, DogeOS and Such App, with intellectual property and development teams contributed by the Dogecoin Foundation and House of Doge. A separate House of Doge release said it would contribute assets to Labs for an equity stake.
For the first hour and a quarter, nothing. The 15-minute bars from 11:45 to 13:00 UTC stayed in a 0.3% band, 0.08195 to 0.08220. After that DOGE pushed up, and the day’s high of 0.0838 came in the 15:15 to 15:30 UTC window. Wednesday closed at 0.08197. Thursday gave back 3.8% and closed at 0.07882. The candles show when things happened. They can’t show whether the release and the Thursday drop are connected, so no link is claimed.
Dogecoin price analysis on the weekly and monthly charts: under its own averages
DOGE peaked at 0.48434 on the December 2024 monthly candle. At 0.0803 that’s 83% under the peak. It’s also 59% under the price of a year ago. Monthly RSI reads 41.4, and the monthly MACD line is below its signal line.
On the weekly chart the coin is pinned just under its 20-week average at 0.0813. The 50-week average is far overhead at 0.0999. Weekly RSI is 44.1. The weekly swing low is 0.06766, set the week of Monday 27 July, and the last weekly swing high is 0.10589 from Tuesday 22 September.
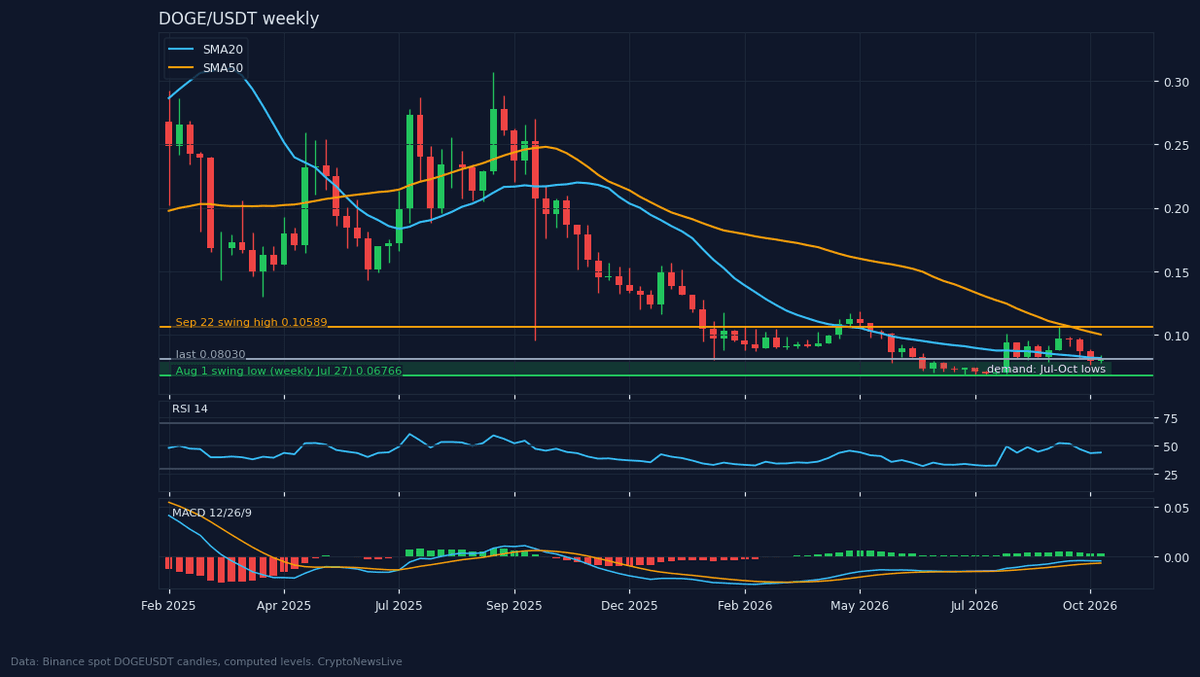
That sets the frame for this Dogecoin price analysis. Since late July the market has bounced inside a range, floor near 0.0677 and ceiling near 0.1059. Price now sits in the lower third of it.
DOGE price levels: Fibonacci and volume
Fibonacci levels give this Dogecoin price analysis its two anchors. Start from the Aug 1 low (0.06766) and run to the Sep 22 high (0.10589). Halfway back is 0.0868. The 0.618 line is 0.0823, and the 0.786 line is 0.0758. The Oct 18 low, 0.07607, stopped within 0.3% of that last one. Right now price is squeezed between those two.
Volume says something similar. Over the last 90 daily candles the busiest price band (the point of control) was 0.0900. About 70% of volume traded between 0.0689 and 0.0970, the value area. DOGE trades in the lower half of it, well under where most volume changed hands.
The 4-hour chart: the range for the Dogecoin price
The 4-hour chart shrinks the decision to a narrow box. The top is the Oct 21 swing high at 0.08378. The bottom is the shelf of equal lows at 0.07783, which is also the prior day’s low from Thursday 22 Oct at 16:00 UTC. Above that shelf sits the prior day’s high at 0.08214. Below it sit the Oct 18 low at 0.07607 and the prior week’s low at 0.07604.
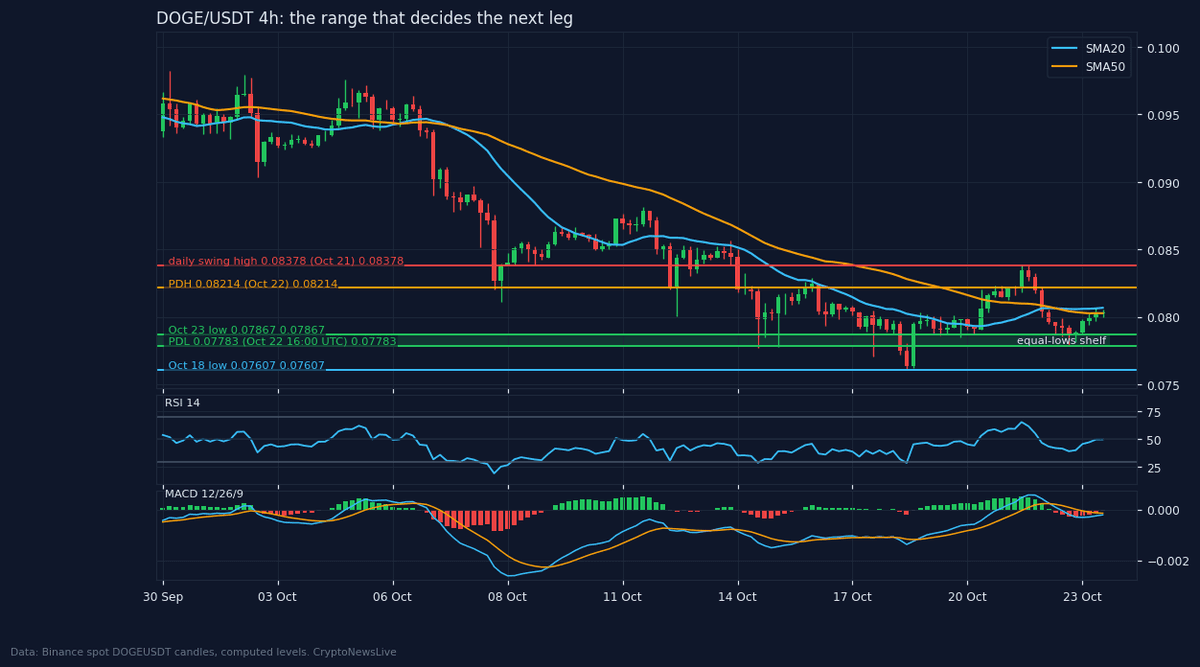
On this timeframe RSI is 49.9, dead center, and the MACD has flattened just under zero. Neither side owns momentum here, and that’s worth saying plainly before any scenario gets drawn.
DOGE price positioning: crowded long accounts and a thinner futures book
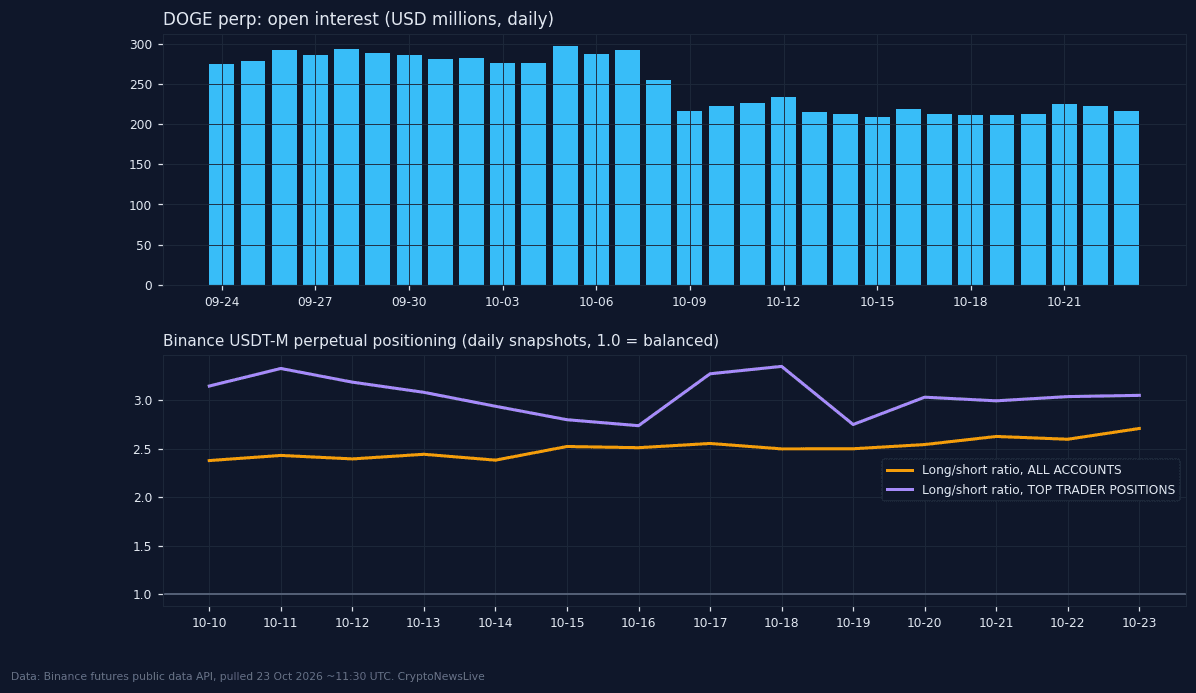
Positioning adds context to the Dogecoin price analysis without adding a verdict. Binance’s USDT-M perpetual open interest stood at $216.6 million on the 23 Oct daily snapshot. It peaked at $297.0 million on Monday 5 October, the high of the 30 daily snapshots pulled. Between the 7 and 9 October snapshots it fell $75.8 million, from $292.4 million to $216.6 million.
The long/short ratio across all accounts was 2.71 on 23 October. That means about 2.7 accounts held long positions for every one short. Among the top traders by position size the ratio was 3.05.
Funding was +0.0067% at the 08:00 UTC print on Friday 23 October. Thursday had two slightly negative prints, -0.0021% at 08:00 and -0.0038% at 16:00 UTC. These are snapshots. They were true when the data was pulled and they won’t stay true for long.
For a wider look at how perpetual-heavy moves have behaved on this site this week, see the IOST hard fork piece and the Binance perp-only token cluster.
Bitcoin, sentiment and the Dogecoin price regime
Bitcoin traded at 82,008 on Binance on Friday morning, above its rising 100-day average near 75,131. DOGE’s daily returns have tracked Bitcoin’s closely. The correlation is 0.85 over 7 days, 0.79 over 30 and 0.83 over 90, based on Binance daily closes. The Crypto Fear and Greed Index read 50 (Neutral) on 23 October after 68 (Greed) the day before, according to alternative.me.
The regime line: Bitcoin is above its rising 100-day average, while DOGE is inside its range, 17.7% under its 20-day high and 5.7% over its 10-day low.
Dogecoin price analysis: two scenarios and the levels that decide them
Up scenario. A 4-hour close above 0.08378 (the Wed 21 Oct swing high) would put price above the last lower high. That opens 0.0856 (equal 4-hour highs from 14 Oct) and then 0.08809 (the prior week’s high). The scenario is cancelled by a 4-hour close back below 0.08214.
Down scenario. A 4-hour close below 0.07783 (the equal-lows shelf) would open 0.07604 (the prior week’s low, with the Oct 18 low at 0.07607 beside it) and then 0.06766, the Aug 1 swing low. The scenario is cancelled by a 4-hour close back above 0.08034.
Which one does this Dogecoin price analysis favor? The facts split. Bitcoin’s regime and the sweep-and-reclaim on 18 October support the up path. DOGE’s own three lower highs, and a price under the 20, 50 and 200-day averages, support the down path. Until one 4-hour close settles it, the read is balanced.
Two dates frame the next week. The weekly candle closes at 00:00 UTC on Monday 26 October, and the October monthly candle closes at 00:00 UTC on Sunday 1 November.
This Dogecoin price analysis is market analysis, not investment advice. Levels can fail, and price can close on the far side of either invalidation line within hours.