A crowded chart is the story of this Shiba Inu price analysis for Friday 23 October 2026. At 14:00 UTC, Binance spot showed SHIB near 5.13. The 20, 50, 100 and 200-day averages are bunched between 5.1 and 5.4. Price is boxed in. It’s parked on the 0.5 retracement of the summer rally, right on the 100-day average. Falling highs sit above, flat lows below.
SHIB trades at fractions of a cent, so every price here is quoted in millionths of a dollar. A price of 5.13 means $0.00000513, and the charts use the same unit. The 4-hour levels come from Binance’s 1000SHIB perpetual, converted to that unit.
Shiba Inu price analysis on the daily chart: falling highs, flat lows
The daily swing highs step down in four stages. Tuesday 22 September gave 6.27. Sunday 4 October, 6.03. Monday 12 October, 5.55. Wednesday 21 October, 5.27. Meanwhile the lows barely moved. The 16 September low was 4.74 and the Sunday 18 October low was 4.80, a gap of 1.3%.
Falling highs over flat lows is the shape chartists call a descending triangle. The name is a label for what the candles drew. It doesn’t predict which side breaks, and this version is only four swings old.
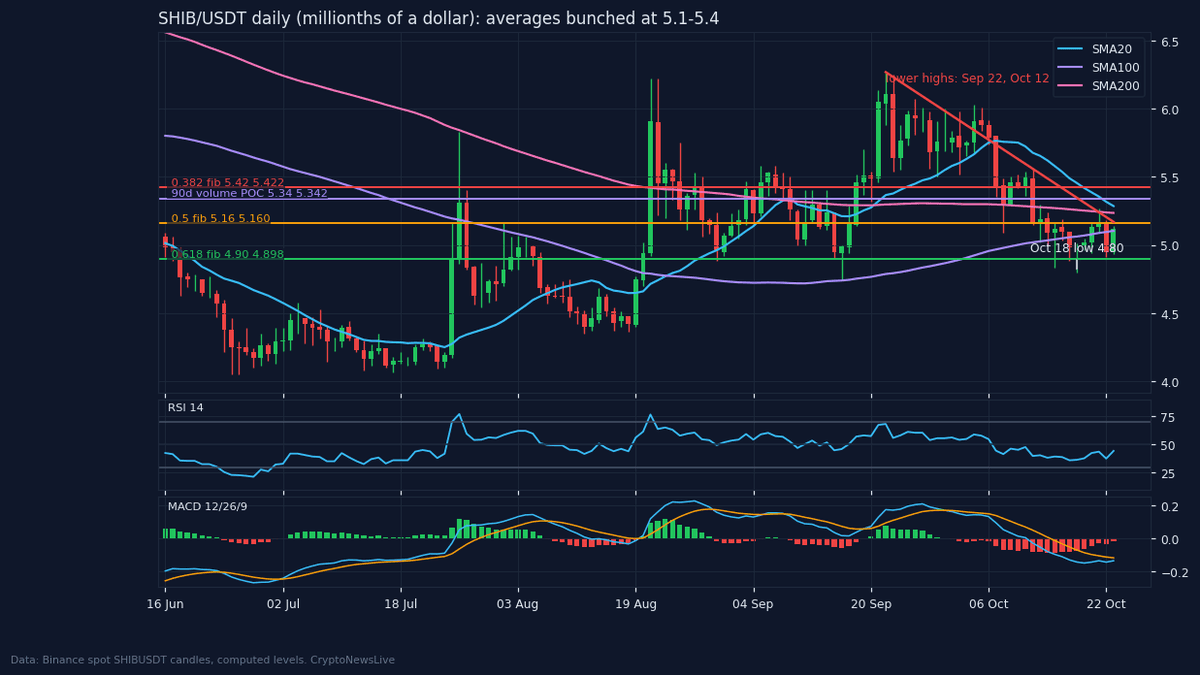
The averages tell the compression story in this Shiba Inu price analysis. Here are the averages as of the 23 Oct candle: 100-day 5.10, 200-day 5.24, 20-day 5.29, 50-day 5.43. That’s a 6.3% band from lowest to highest, and price is inside it. Daily RSI reads 44.4. The daily MACD line sits under its signal line with a small negative histogram.
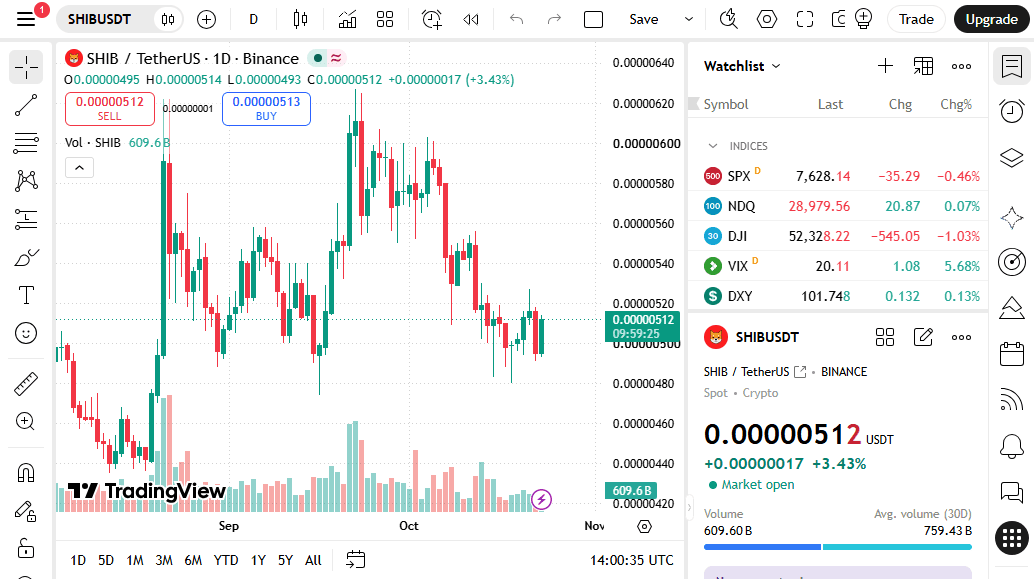
The TradingView daily chart shows the same candles, 6.27 down to 4.80, with nothing drawn on top.
SHIB burns: the numbers are small next to the supply
SHIB’s burn tracker, Shibburn, showed 2.47 million SHIB burned in the last 24 hours, about $12. Over 7 days it was 67.24 million (about $341), and over 30 days 673.38 million (about $3,810). Total burned is 410.845 trillion SHIB. That’s 41.08% of the original quadrillion supply. Circulating supply is 585.49 trillion.
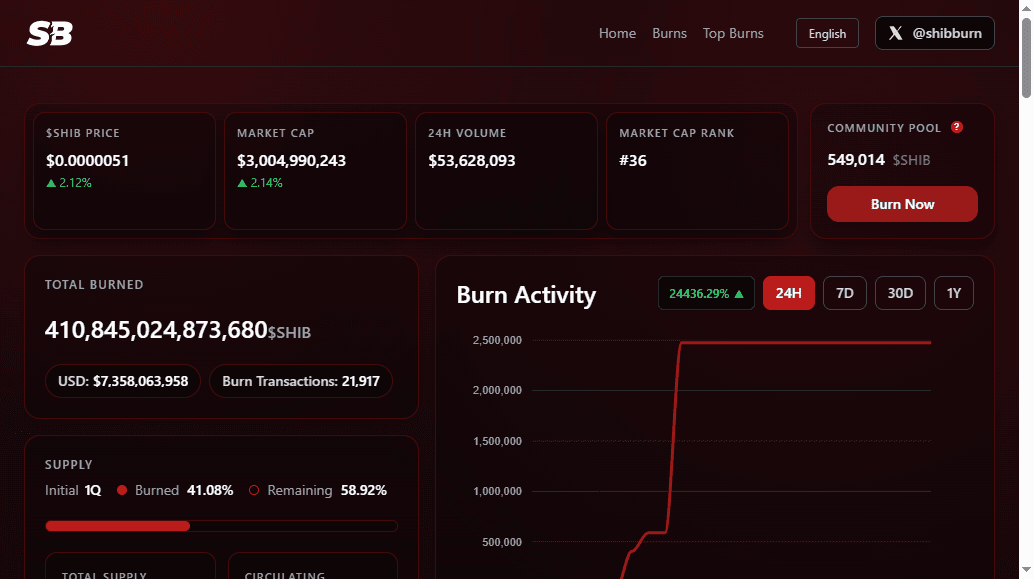
The 30-day burn is about 0.000115% of what circulates. At that pace, burning one percent of it would take roughly 720 years. Burns are a real on-chain process, and the dollar values above are the ones Shibburn itself shows. Nothing in the daily structure above, from the 6.27 high to the 4.80 low, reflects a burn pace that small.
Shiba Inu price analysis on the bigger frame: a year of losses and a June floor
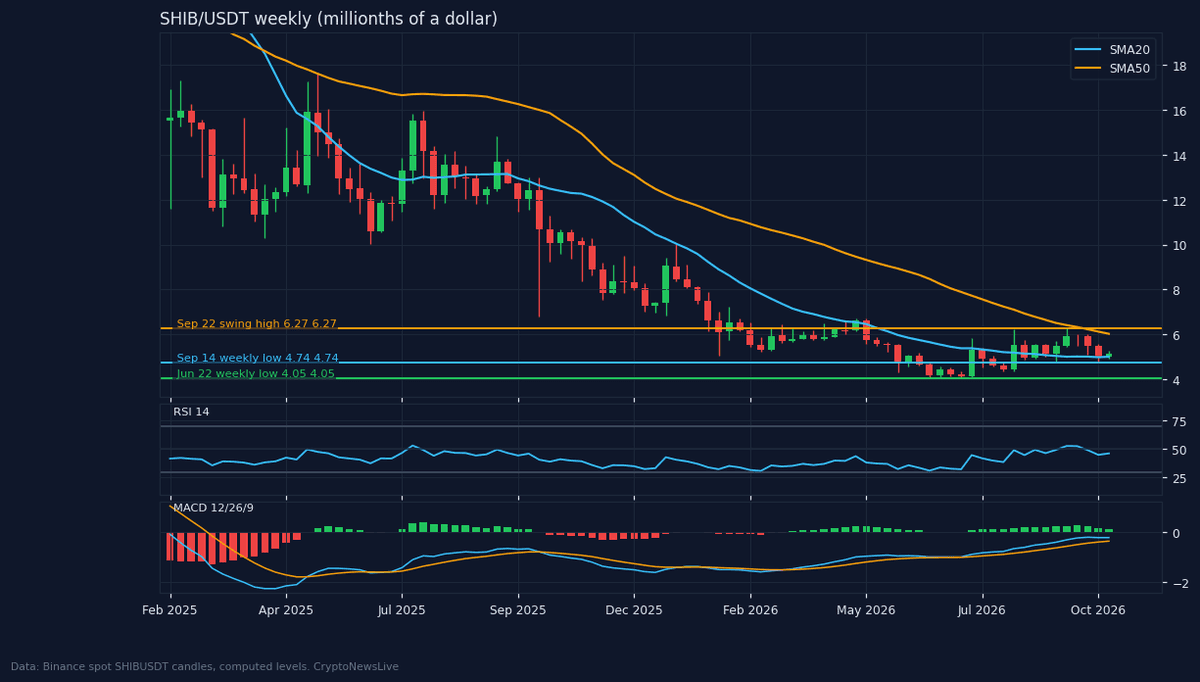
SHIB is down 49% over 365 days and 9% over the last 30, per Binance daily closes. Over 90 days it’s up 4.7%. Monthly RSI is 33.6, and the monthly low is the June 2026 candle at 4.05.
The weekly chart is less grim. Price sits above the 20-week average at 5.0 and below the 50-week at 6.0. Weekly RSI is 46.2. The weekly swing lows are 4.05 (week of Monday 22 June) and 4.74 (week of Monday 14 September). The last weekly swing high is 6.27 from Tuesday 22 September.
SHIB price levels: Fibonacci and volume
Take the 26 June low, 4.05, and the 22 September high, 6.27. The 0.382 retracement falls at 5.42. The 0.5 sits at 5.16, the 0.618 at 4.90 and the 0.786 at 4.53. SHIB has given back 52% of the rally, so the 0.5 line is the one in play. The 0.618 line is roughly 4% under the last print.
Volume over 90 days peaked at 5.34, the point of control, and most trading happened between 4.67 and 5.95. Price is in the middle of that area, a little under the point of control.
The 4-hour map of the Shiba Inu price
The 4-hour chart gives the working range for the Shiba Inu price. The top is the Oct 21 daily swing high at 5.27, with the prior day’s high at 5.18 just under it. The floor is the Thursday 22 October low at 4.91. Between them sit the 4-hour equal lows at 5.01 (three touches, first set 16 Oct) and the daily swing low of 4.82.
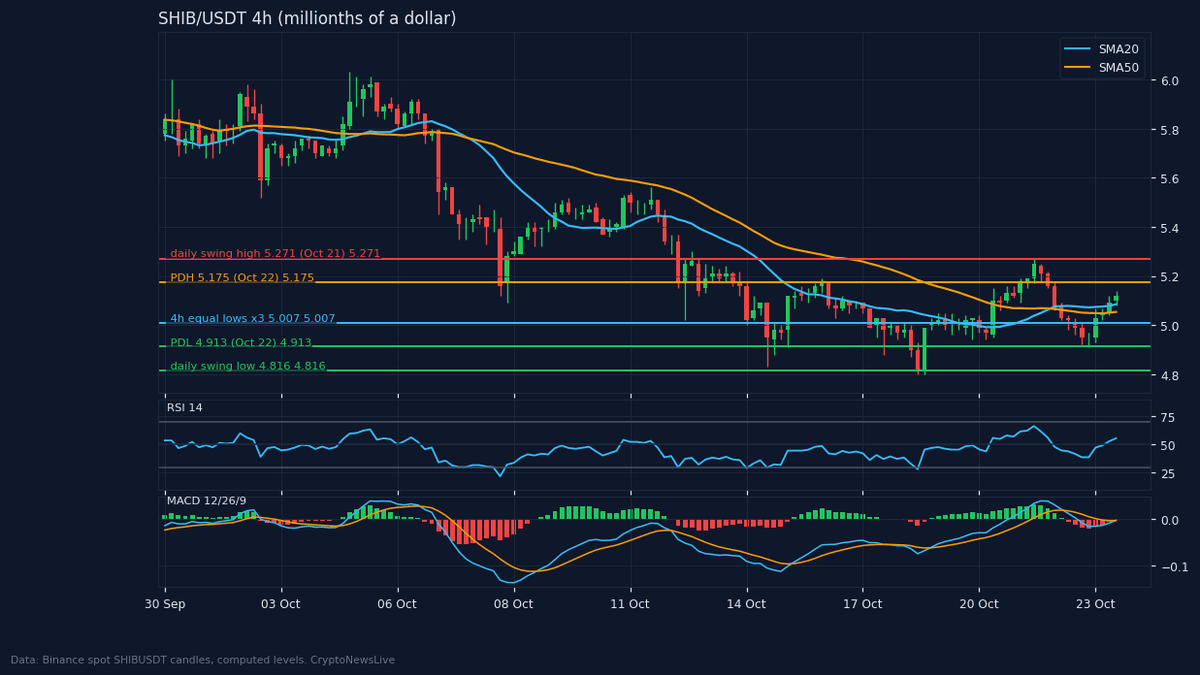
On this timeframe RSI is 55.6, a little above midline, and the MACD sits marginally above its signal. That’s a small positive lean on the shortest chart. The longer charts don’t share it.
SHIB price positioning: open interest down a third from its peak
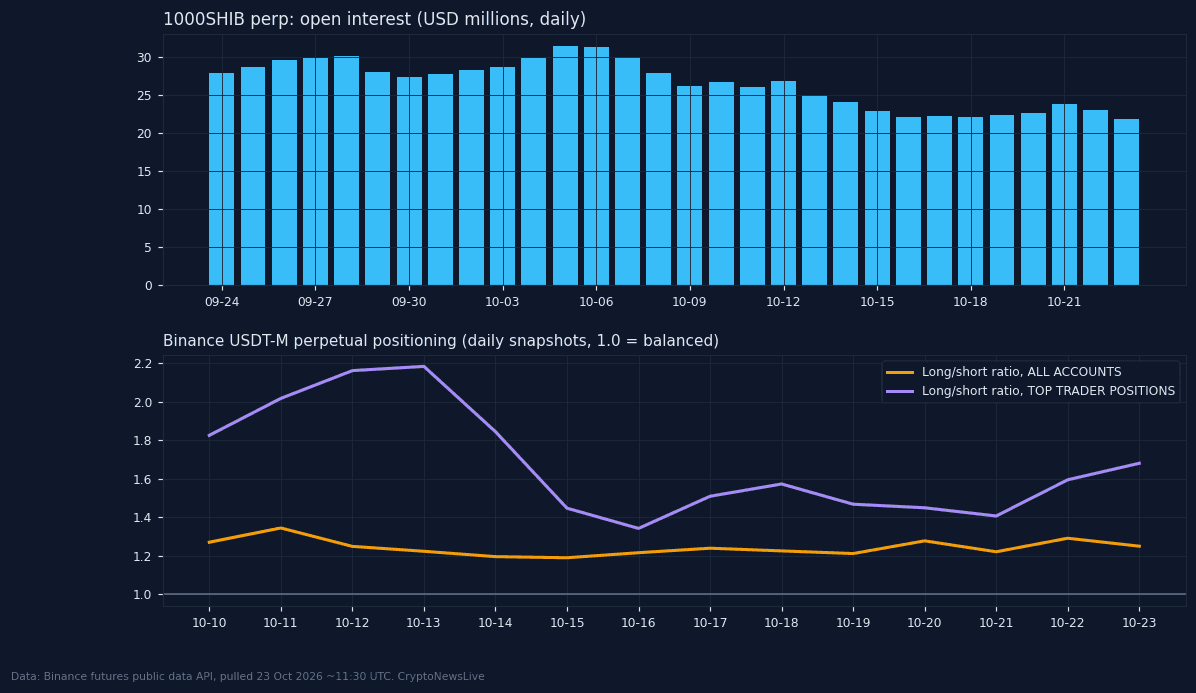
Open interest on Binance’s 1000SHIB perpetual was $21.8 million on the 23 October daily snapshot, the lowest of the last 30. It peaked at $31.4 million on Monday 5 October. That’s a 31% drop in 18 days. The long/short ratio across all accounts was 1.25, and 1.68 among the top traders by position size. Both lean long, though far less than DOGE’s 2.71 and 3.05.
Funding printed +0.0100% at 08:00 UTC on Friday 23 October, after a negative print of -0.0102% at 16:00 UTC on Thursday. Both are snapshots.
For the other big meme coin, see the companion [Dogecoin price analysis](https://www.cryptonewslive.org/article/dogecoin-price-analysis-doge-sits-between-two-fibonacci-levels/), and for how perpetual-led moves have played out lately, the IOST hard fork piece.
Bitcoin, sentiment and the Shiba Inu price regime
Bitcoin traded near 82,008 on Binance on Friday morning, above its rising 100-day average near 75,131. SHIB’s correlation with Bitcoin is 0.80 over 7 days and 0.79 over both 30 and 90, based on Binance daily closes. The Crypto Fear and Greed Index read 50 (Neutral) on 23 October after 68 (Greed) the day before, per alternative.me.
The regime line: Bitcoin is above its rising 100-day average, while SHIB is inside its range, 15.5% under its 20-day high and 6.5% over its 10-day low.
Shiba Inu price analysis: two scenarios and the levels that decide them
Up scenario. Close a 4-hour candle above 5.27, the Wed 21 Oct swing high, and the last lower high is cleared. That opens 5.49 (4-hour equal highs from 10 Oct) and then 5.55 (the prior week’s high). The scenario is cancelled by a 4-hour close back below 5.18.
Down scenario. A 4-hour close below 4.91 (the Thu 22 Oct low) would open 4.82 (the daily swing low from 15 Oct) and then 4.74 (the prior month’s low, which matches the weekly swing low from 14 Sep). The scenario is cancelled by a 4-hour close back above 5.01.
Which side does this Shiba Inu price analysis favor? Neither clearly. The falling highs and the price under three of four daily averages argue for the down path. The flat lows, the 0.5 retracement holding and a bullish Bitcoin regime argue for the up path. With the averages this tightly packed, a decisive 4-hour close either way would settle more than another day of drift. Until then the read is balanced.
Two dates frame the next week. The weekly candle closes at 00:00 UTC on Monday 26 October, and the October monthly candle closes at 00:00 UTC on Sunday 1 November.
This Shiba Inu price analysis is market analysis, not investment advice. Levels can fail, and price can close on the far side of either invalidation line within hours.