dYdX’s chart just told on itself. The derivatives exchange token spent the back half of July grinding out two nearly identical highs — one near $0.129, one near $0.131 — and both times the RSI Divergence Indicator on TradingView flagged the same warning: bearish divergence, momentum fading even as price pushed higher. Nobody had to wait long to find out which side was right.
The Double Top Nobody Priced In
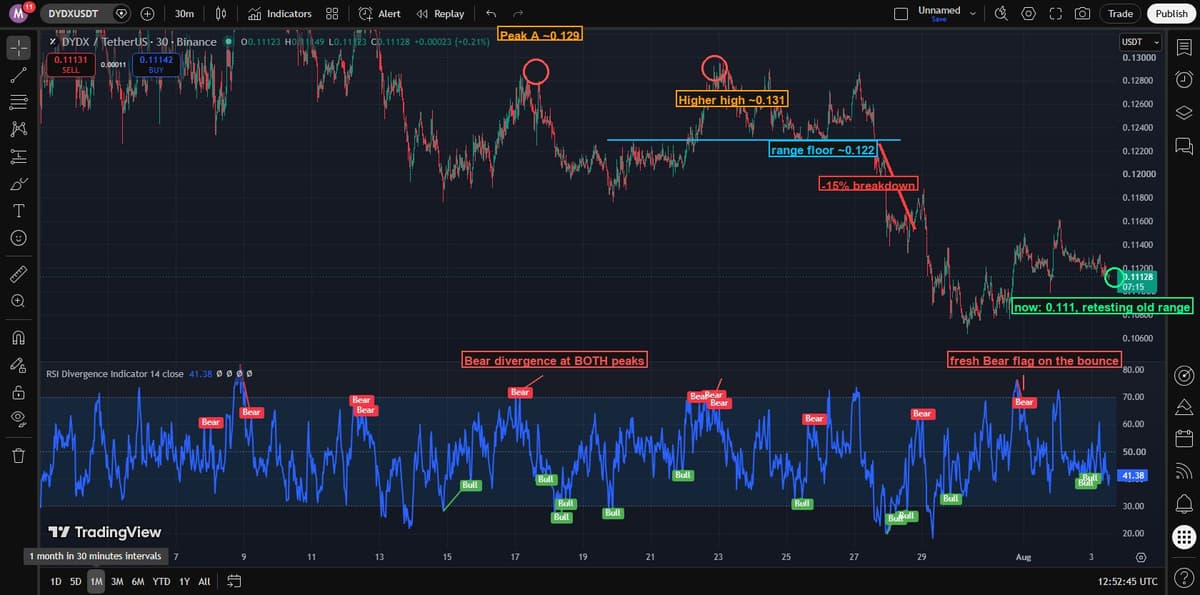
By July 28 the token broke through the range floor around $0.122 that had separated the two peaks, and kept going — a roughly 15% single-leg drop that didn’t stop until price found $0.108, a level DYDX hadn’t traded at since May.
A Round-Trip Back Into Old Territory
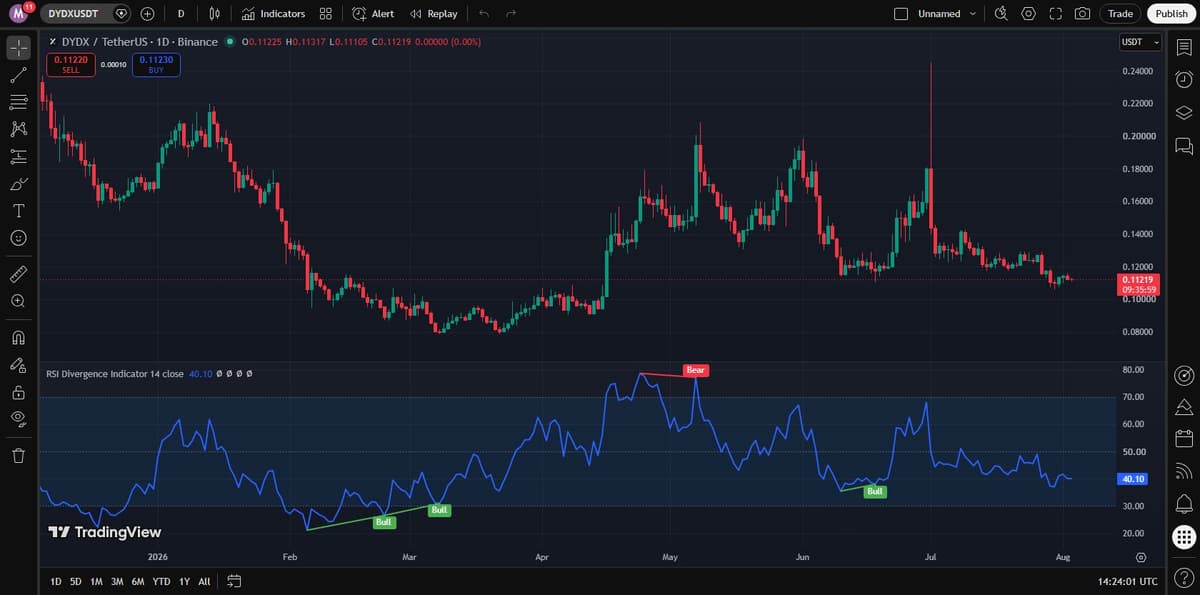
Zooming out shows what that $0.108 floor actually is: not new support, but a level squarely inside the token’s own broader range over the past year. DYDX spent large stretches of 2026 chopping between roughly $0.09 and $0.16 before this particular rally pushed toward $0.13 — and that rally has now been mostly given back.
The Bounce Failed Too
The token did try to bounce. From the $0.108 low it clawed back to roughly $0.115 over the following few days — and the RSI Divergence Indicator printed a fresh bear flag on that bounce too, the same signal type that called both July tops, this time arriving within days instead of weeks. As of writing, DYDX trades at $0.1112, RSI sitting in the low-to-mid 40s on the 30-minute chart — cooling, not oversold, with no bull divergence anywhere near the current price to counter the bearish read.
What the Derivatives Say
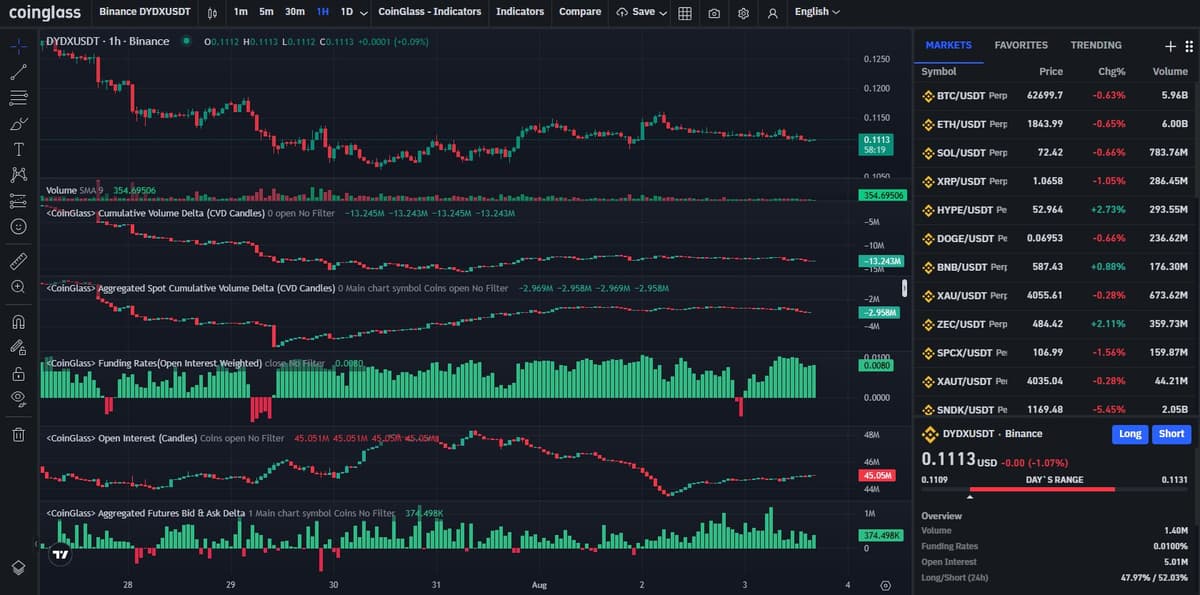
The derivatives data doesn’t point to a squeeze in either direction. On Binance, DYDX funding has stayed mild and mostly positive through the entire move (around 0.01%, nowhere near the extremes that usually accompany a forced unwind), and open interest fell alongside price — from roughly $48 million in mid-July to about $45 million now — which reads as long-side deleveraging riding the drop down, not fresh short-building piling on top of it. The long/short account ratio on Binance sits close to even, roughly 48/52 in favor of shorts.
Not a Bitcoin Story
None of this is a Bitcoin story. DYDX’s 30-day correlation to BTC, computed from CoinGecko’s own daily price history, comes out to -0.03 — statistically zero — and even the 7-day reading is a weak 0.15. Whatever is driving this chart, it isn’t beta.
Zoomed out, DYDX is down 14.5% over the past 30 days, sitting close to where it was before the rally started, with a technical setup that has now flagged the same bearish signal three separate times in three weeks — twice at the top, once on the recovery attempt. The $0.108 low held once. Whether it holds again is the only question the chart hasn’t answered yet.
This article is for informational purposes only and does not constitute financial or investment advice. Cryptocurrency markets are highly volatile — always do your own research before making investment decisions.