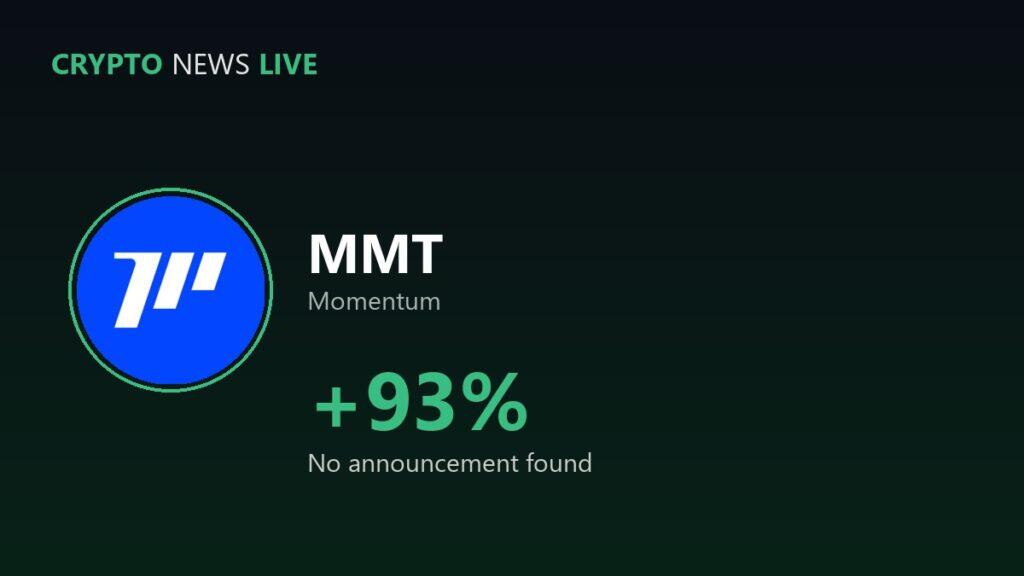
Momentum did not have any news by Nov. 18, 2026, that would give an explanation of why the MMT token rose in price almost doubling its value. CoinGecko says that the MMT token rose 93 percent in price in the last 24 hours at $0.241. This rise happened in one hour of the MMT/USDT chart of Binance, specifically the 05:00 UTC hour from 0.1523 to 0.2194.
Nothing was located from the project, from any partner or from any exchange that would explain the phenomenon. The announcement list of Binance does not have anything regarding the MMT token on November 18.

How big is the MMT token next to its trading value?
The MMT token’s total market capitalization is at $49.2 million, and 204 million of the 1 billion tokens available are in circulation. When adding up all the tokens, the fully diluted valuation comes to $241 million.
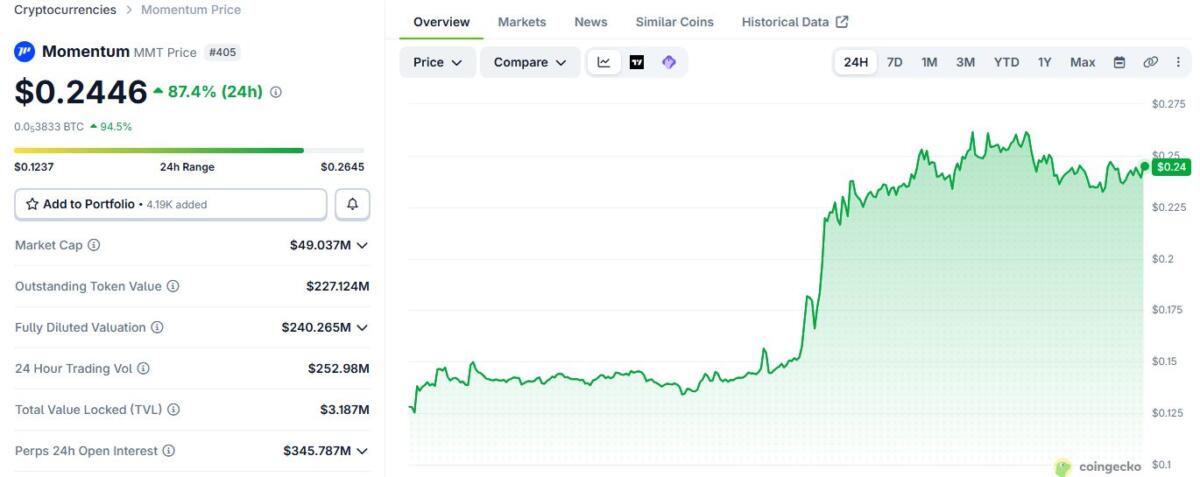
For the last 24 hours, the volume traded stood at $280.8 million according to CoinGecko, making the number 5.7 times the market cap. Secondly, according to CoinGecko, there is open interest for $355.9 million of perpetual futures, which is an active leveraged trade amounting to more than seven times the market cap.
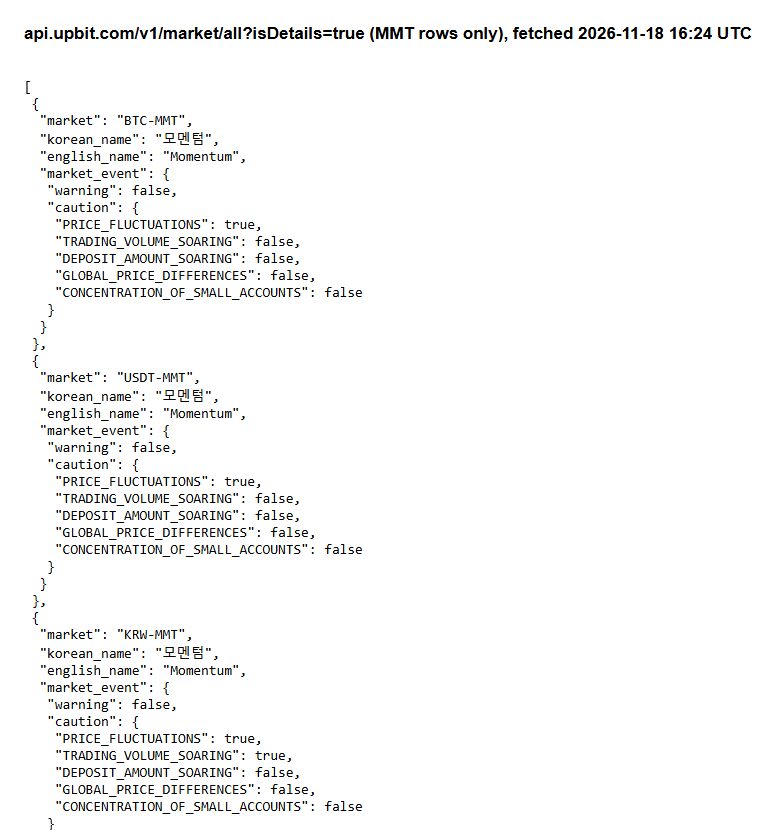
Upbit pointed out the KRW-MMT combination on November 18, with two warning flags that are the volatility and the growth in trading volume. The stronger warning flag for all MMT token combinations is flagged as false by the Upbit API.
What Momentum’s own numbers say
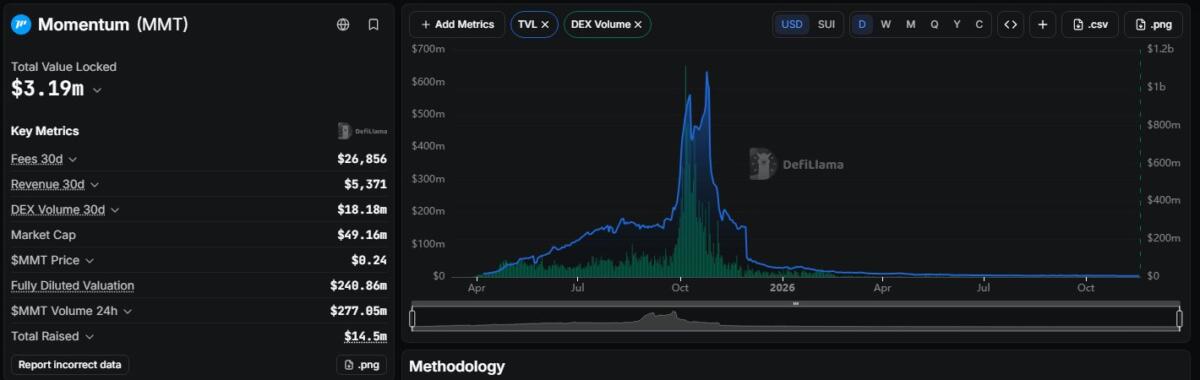
DefiLlama has stated that the total value locked on Momentum, meaning the value that is locked on its trading pools on the Sui blockchain network, totals $3.19 million. The very same graph indicates that the highest point was over $600 million in late 2025.
The platform has made $26,856 worth of swap fees from $18.18M worth of trades within the last 30 days, of which $5,371 went into the treasury. The volume for one day of MMT token volume on exchanges is more than that in a month for trading on the protocol, with a market cap of 15 times the locked value.
A rally with no stated reason has happened before. Pieverse reached a record high with no news on Nov. 9.
Where the 4-hour chart stands
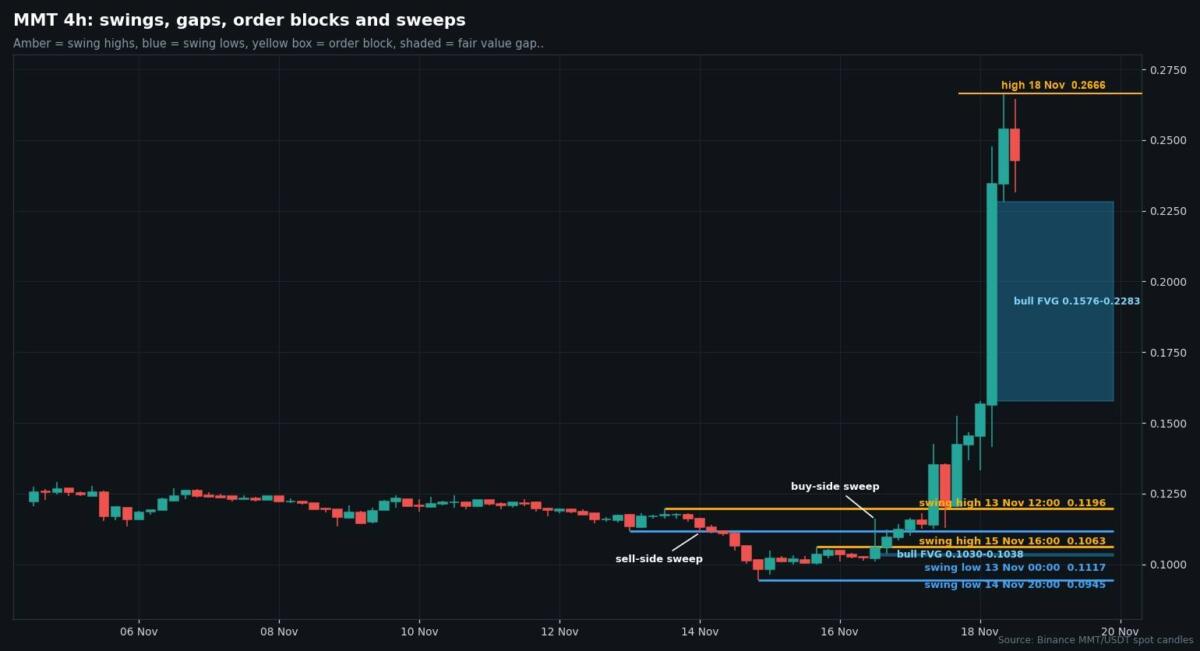
Before November 18, the crypto token had been trading lower and reached its lowest at 0.0945 on November 14. After that, the token had traded higher and managed to trade above two recent highs, 0.1196 from November 13 and 0.1063 from November 15, before the candle of 05:00 UTC on November 18 carried it far above both.
The shaded zone on the chart, 0.1576 to 0.2283, is a gap, because price moved through it too quickly for almost any trading to occur there. This is referred to as a fair value gap. The MMT token has not traded below 0.2283 since 08:00 UTC, while the high so far is 0.2666. Bitcoin is trading below its 100-day moving average at $62,396 on Binance, as covered in the FOMC minutes article, while MMT is above its 20-day high.
What would change the picture for MMT token holders
In case a 4-hour candle closes above 0.2666, the price would be above all the lines marked, and no earlier level for November would remain for comparison. In case a 4-hour candle closes below 0.2283, the move would begin to be undone, while a close below 0.1576 would erase the gap. Neither has taken place yet, and the evidence does not favor one side.
Moves of this size can reverse as quickly as they form, and this is not investment advice. The all-time high for MMT is $4.03 set on Nov. 4, 2025, so even after this rally the coin trades about 94% below it.