XRP below $1 is where things stand after Saturday’s drop, and it has not climbed back above that line since. On Binance, spot XRP closed at $0.9144 on Saturday, Nov. 14, and at $0.9742 on Sunday, Nov. 15, its first daily closes under $1 since Aug. 16.
Open interest on XRP below $1 shows traders exiting the market instead of entering it. The open interest in XRP perpetual contract on Binance fell from $448.7 million on Nov. 5 to $277.0 million on Nov. 15, a decrease of 38%.
How XRP fell from $1.34 to $0.89 in ten days
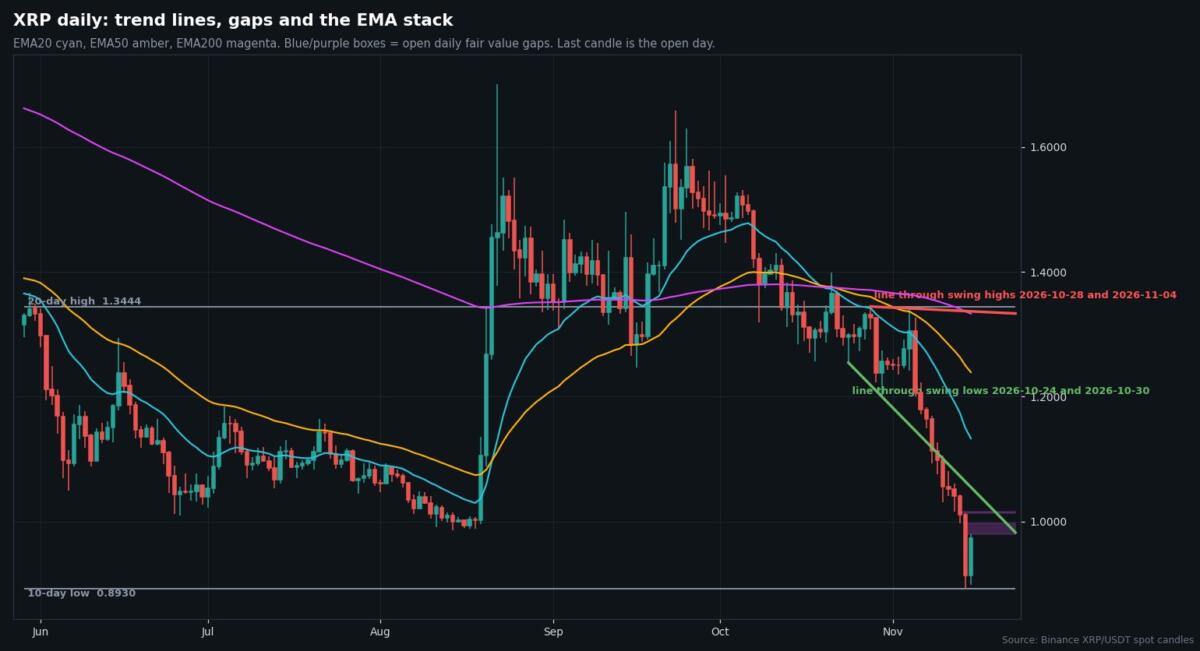
The high point for the above price action was $1.3414 on Nov. 4. The low was recorded on Saturday, Nov. 14, at $0.8930, representing a 33.4% drop. On Saturday alone, XRP tumbled from an opening price of $1.0109 to close at $0.9144, which is a one-day drop of 9.6%, and its low that day was 2.3% under the close.
At the time of analysis of the XRP 4-hour order block on Oct. 28 by CryptoNewsLive, the price level stood at around $1.30. But after that, the daily price chart has formed lower highs, with XRP now trading below the green line connecting the Oct. 24 and Oct. 30 low levels.
The daily close on Saturday is also the lowest daily close for XRP since Nov. 15, 2024, when the daily close was at $0.8922.
What open interest and funding show for XRP below $1
Open interest is the monetary size of outstanding futures. It reached $448.7 million in Binance’s XRP perpetual on Nov. 5, and decreased on nine out of eleven following days. Two tiny increases were recorded on Nov. 13 and Nov. 16. Decreasing open interest amid falling prices means that positions are unwinding, either by choice or force.
Funding rate, which is a small payment made by short-side to long-side traders on perpetual futures, was slightly negative for the last six settlements, from 00:00 UTC on Nov. 15 to 16:00 UTC on Nov. 16. This means that shorts make a payment to longs. Largest among these numbers is 0.007%.
These numbers do not explain why XRP declined. They just describe positions, and come from the Binance data itself.
Why XRP below $1 matters on the weekly chart
From Aug. 10 to Aug. 18, XRP traded in a narrow range at or just above $1, and the weekly low in that stretch was $0.9862. On Aug. 18 it began to rise from $1.0019 and reached $1.4544 on Aug. 21, a gain of 45.2% in three days.
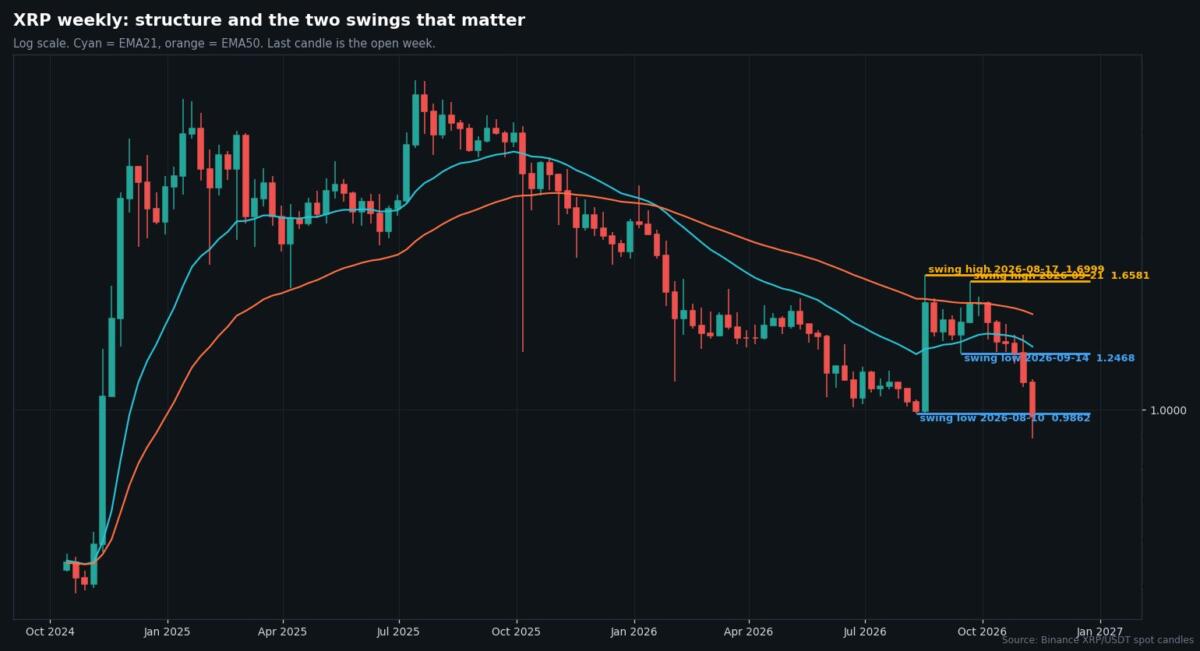
All of that move has been given back. Saturday’s close of $0.9144 leaves XRP below $1, under the Aug. 10 weekly low and under the start of the August rally.
The 4-hour levels for XRP below $1
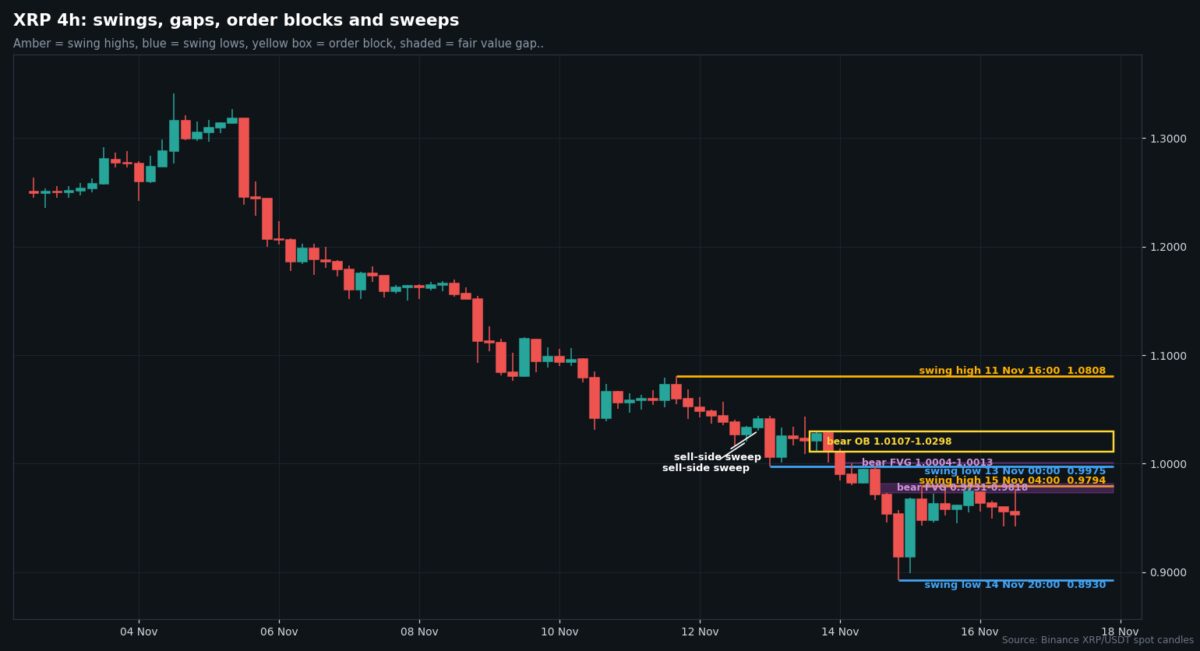
The 4-hour chart marks the Nov. 14 low at $0.8930 and the Nov. 15 high at $0.9794. Above these levels lies the gap formed between $1.0004 and $1.0013, swing low at $0.9975, and the range of $1.0107 to $1.0298, which represents the last bullish candle prior to the fall.
XRP is volatile, and positions can lose money quickly in either direction.
If a 4-hour candle closes below $0.8930, XRP would be at a new low for this leg. The lean is to the downside as long as the price is below the lower highs on the daily chart, but this lean would fail if a 4-hour candle closed above $0.9794. Closing above $0.9794 would open up $0.9975, followed by the range of $1.0107 to $1.0298, and the recovery scenario fails on a 4-hour close under $0.8930.