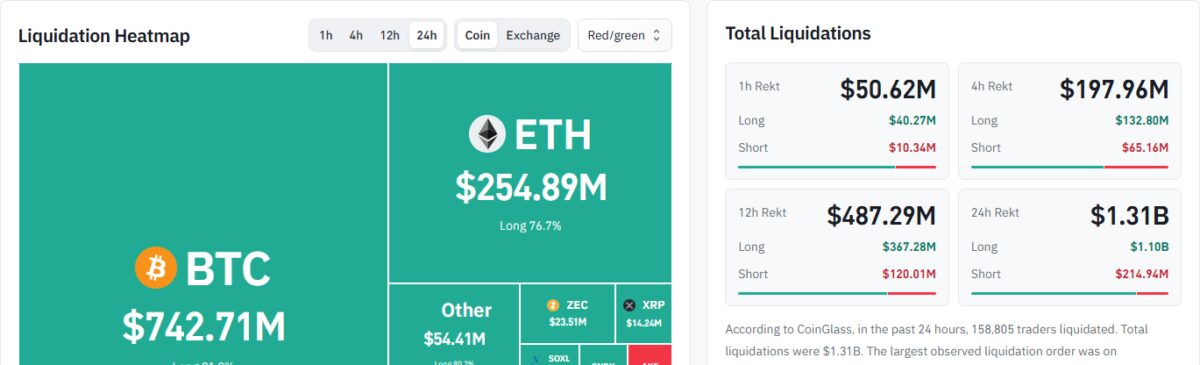
Out of the $1.31 billion worth of crypto trades forced shut within the last 24 hours, $1.10 billion, which amounts to 83.6%, were buy positions, as per CoinGlass.
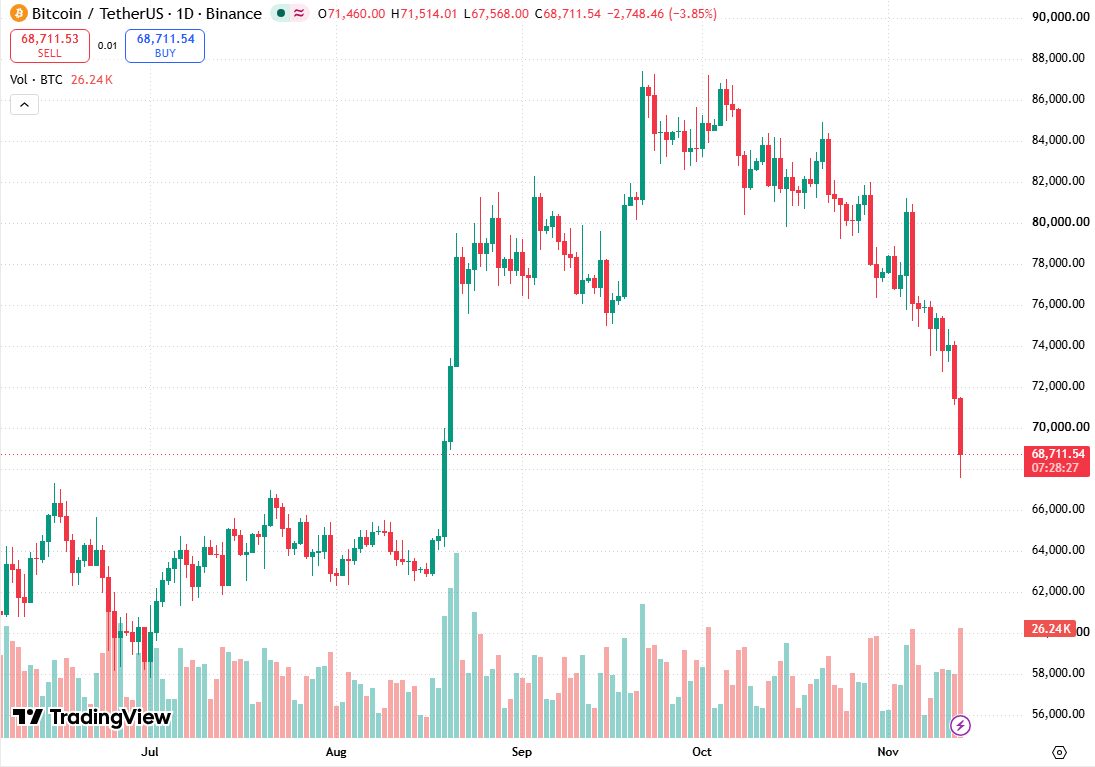
A liquidation takes place when an exchange liquidates a borrowed position as there is not enough collateral in order to offset the losses. That is exactly what happened because of Bitcoin below $70,000. The cryptocurrency traded at $67,568 on Binance on Nov. 13, 2026, reaching the lowest point since Aug. 20, and was trading around $68,700 at the time of writing.
CoinGlass found 158,805 liquidated traders. Bitcoin positions constituted $742.71 million out of the total, and ether $254.89 million. The largest order liquidated was a $20.15 million long position on Hyperliquid at $70,480, and Binance accounted for 37.6% of total liquidations.
Bitcoin is under $70,000 for the first time in nearly three months
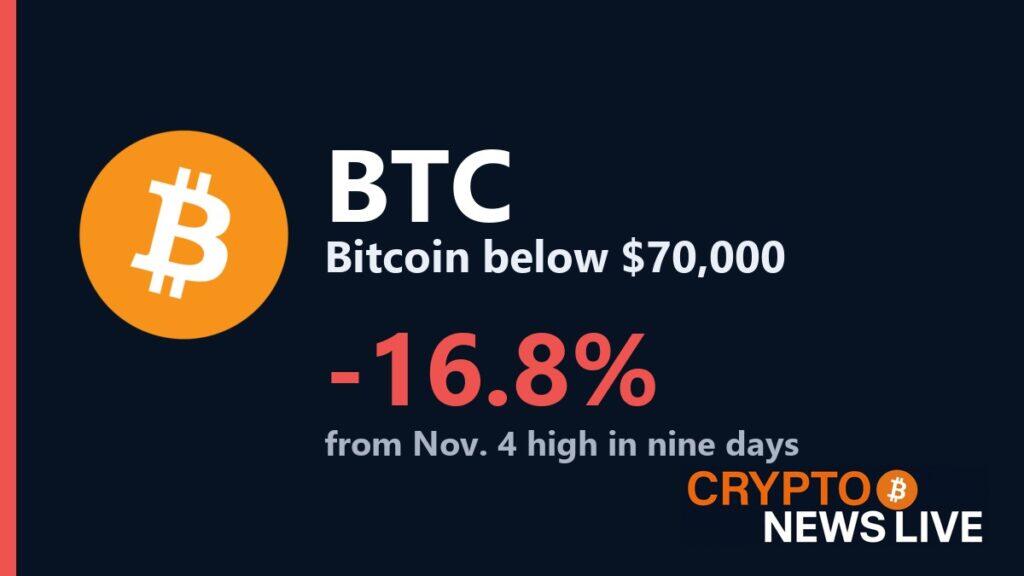
The digital currency declined by 3.5% on Nov. 12 to close at $71,460 and fell again by 3.9% on Nov. 13 at the time of writing. From its peak value of $81,196 on Nov. 4 to the current low, the drop is 16.8% in nine days.
The last time that the daily low was under $70,000 was Aug. 20, when it reached $68,902 before the price jumped. Other major coins also fell with bitcoin below $70,000. According to Binance, ether stands at $1,931, which declined by 4.0% in 24 hours; solana at $79.67 declining by 2.3%, and XRP at $1.01, declining by 0.9%.
The 200-day average gave way on Nov. 12
The 200-day moving average is a simple moving average of the last 200 daily closing prices, and traders consider it a broad gauge of whether the trend is strong or not. Bitcoin closed below it on Nov. 12, at $71,460 compared to a level of $73,137. That was the first daily close below it since Aug. 18.
The 50-day moving average is at a slightly higher level of $80,631 and represents how far the price has fallen from where it has traded for much of the fall period. The week that ended on Nov. 8 closed at $74,851, below the $74,968 low reached in the week beginning Sept. 14. We covered the 200-day moving average on Nov. 10.
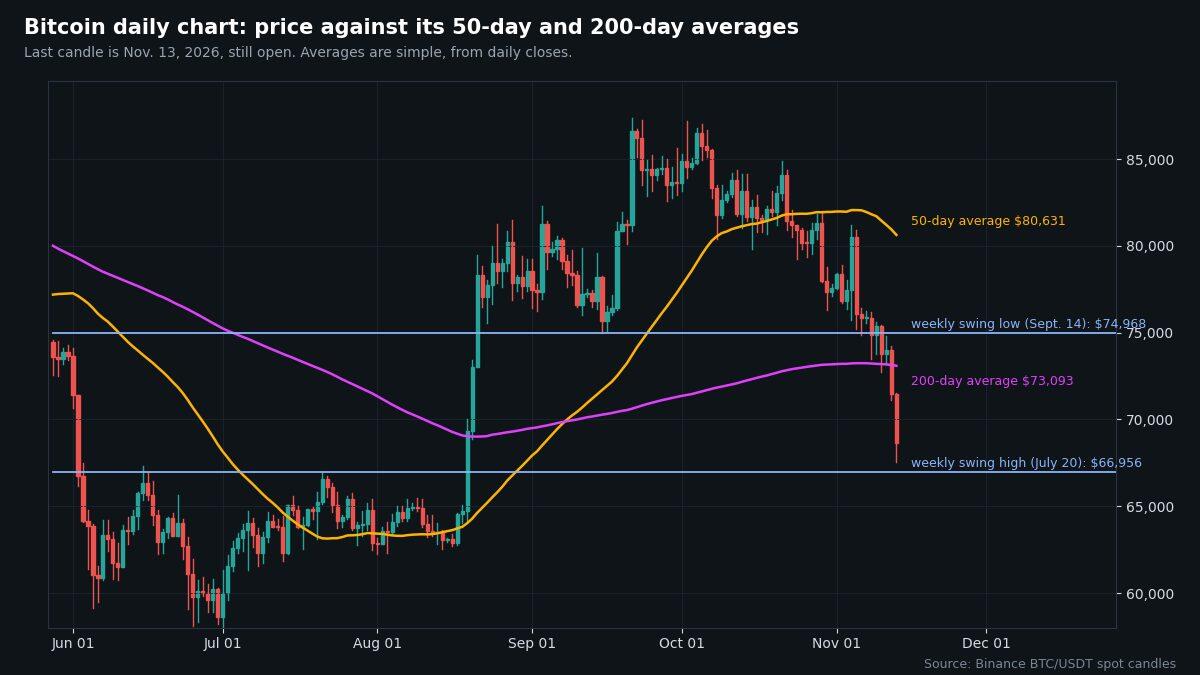
The next marked level below is $66,956, the high of the week of July 20. Prices tend to respond around levels where buyers or sellers have acted before, and the low of $67,568 for bitcoin halted just 0.9% above this one.
Spot Bitcoin ETFs have sold for six sessions in a row
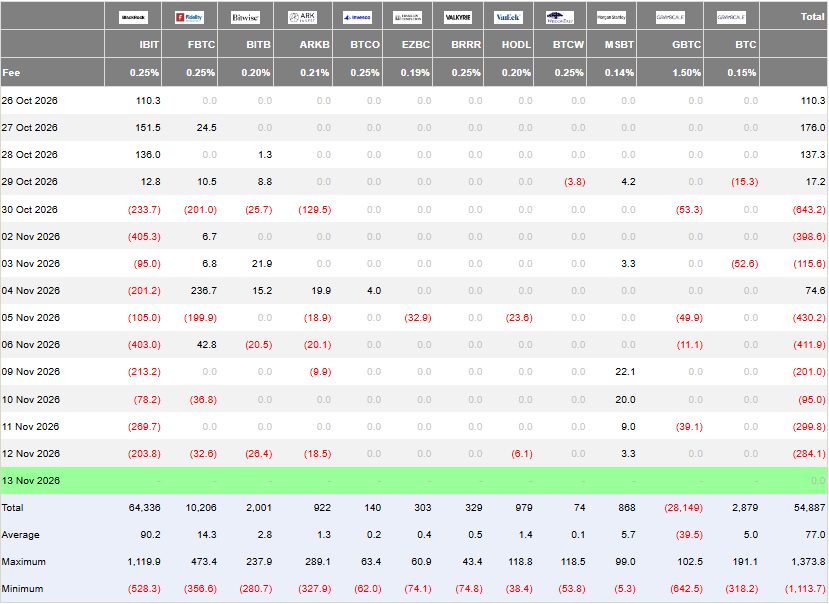
Spot bitcoin funds registered negative net flows during each trading session between Nov. 5 and Nov. 12. The total net outflow for that period is $1.72 billion by Farside Investors, including a net outflow of $284.1 million on Nov. 12. That figure includes $203.8 million of net outflow from BlackRock’s IBIT. The last positive net flow occurred on Nov. 4 at $74.6 million.
Farside tells us what the funds did but not why they were being sold. Our ETF outflows report published on Nov. 11 covered the seven sessions up to Nov. 10.
What else happened on Nov. 12
On Nov. 12, Nvidia announced that Jensen Huang stepped down as the company’s CEO, with CFO Colette Kress acting as an interim CEO. Nvidia reports quarterly earnings on Nov. 17.
What to watch from here
The point about the liquidation numbers is that leverage accelerates the decline. The price goes down when forced selling happens, leading to even more forced selling. As long positions account for 83.6% out of the total $1.31 billion, this is the side affected by the decline.
There is nothing forced for anyone holding bitcoin without leverage. The price just went down compared to a week ago. For leveraged traders, the key level to keep an eye on is the $66,956 one on the chart above and the ability to go back over the 200-day MA at $73,100.
Crypto is volatile, and prices can move quickly in both directions, so holders can lose money. With bitcoin below $70,000, the currency is trading 45% below its peak value of $126,199.63, which was seen on Oct. 6, 2025.