Bitcoin is sitting right on its 200-day line. Yahoo Finance had it at $73,299 on Tuesday morning in New York, just $109 over the Bitcoin 200-day average of $73,190, while US stocks were still winning back what they lost last week.
That average is simply the mean of the last 200 daily closes. Every close since 19 August has landed above it.
Tuesday did dip under it. The low was $72,866, the first trade below the line since 20 August. Most chartists wait for a daily close before calling that a break, though.
Stocks recovered, Bitcoin kept falling
We lined Bitcoin up against the S&P 500 and Nasdaq-100 at the 4 pm New York close each day, with index data from Yahoo Finance and Bitcoin from Binance’s BTC/USDT market. The starting line is 4 November, the last session before the selloff.
5 November was ugly for everything. Bitcoin gave up 4.9%, the S&P 500 dropped 4.4%, and the Nasdaq-100 fell 6.4%.
Then stocks bounced. Monday alone added 3.4% to the Nasdaq-100 and 2.4% to the S&P 500, which put them about 1.9% and 1.8% under where they started.
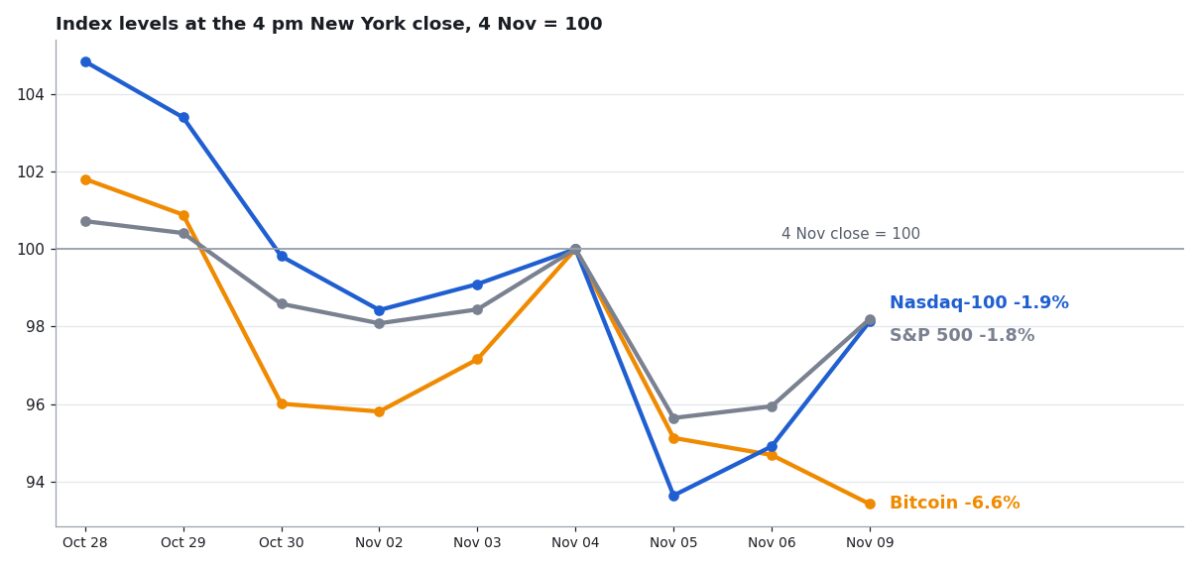
Bitcoin stayed home. By Monday’s close it was 6.6% under its 4 November level, and 1.3% lower than at Friday’s close.
Distance from the peak tells a similar story. Even after Monday’s jump the Nasdaq-100 is about 11% under its 6 October record close. Bitcoin trades 41% under its record close of $124,659, set on 6 October 2025.
Tuesday showed the same split. At 11:25 am in New York the S&P 500 was off 0.65% and the Nasdaq 0.85%, but Bitcoin had lost 2.23%. Treasuries were selling off as well. The 10-year yield had climbed to 4.99%.

The Bitcoin 200-day average has a 50-week line above it
Two lines matter on the daily chart, and they sit close together. The Bitcoin 200-day average is at $73,190 and barely moves, about $20 a day. The 50-week average, built from weekly closes, is $75,195. That one is above the current price.
Bitcoin’s weekly close on 8 November, $74,851, was beneath the 50-week average, the first such close since mid-September. The rebound attempt before that stopped at $81,196 on 4 November.
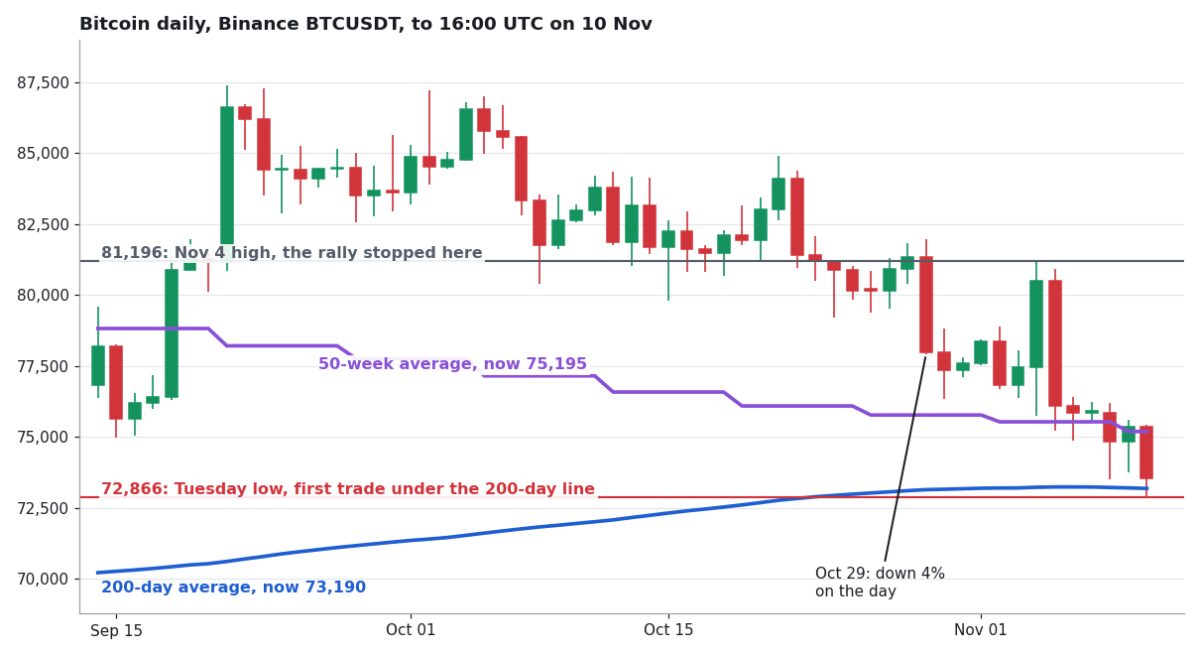
A daily close under roughly $73,200 would end an 84-day stretch above the Bitcoin 200-day average. A close over $75,195 would take Bitcoin back above the 50-week one. Neither has happened yet.
What followed earlier breaks of the Bitcoin 200-day average
Binance’s daily history goes back to 2017, so we checked. Seven times Bitcoin had spent at least 60 days above its 200-day average and then closed under it. A month later the price was higher three times and lower four times. The best result was a 14.5% gain after the 2019 break, the worst an 11.4% loss after the one in 2025.
So the 200-day average has not called the next month either way. It just marks the spot where more traders start looking.
For anyone holding Bitcoin, nothing has broken yet. The price is simply at a level that many traders watch, with the stock market showing a strength crypto has not copied.
The Federal Reserve’s next policy meeting runs on 8 and 9 December, according to its published calendar. Until then, stocks and bitcoin will be judged against the same two numbers on the chart: $73,190 below, $75,195 above.