
The US spot bitcoin ETFs have lost $1.58 billion in net withdrawals since Nov. 2, going by Farside Investors‘ daily table, and six of the seven trading days to Nov. 10 ended with money going out. That run of Bitcoin ETF outflows is what bitcoin has been trading against.
Only Nov. 4 broke the pattern, with $74.6 million coming in before the selling started again. Worst of all was Oct. 30, just ahead of the window: $643.2 million out in a day.
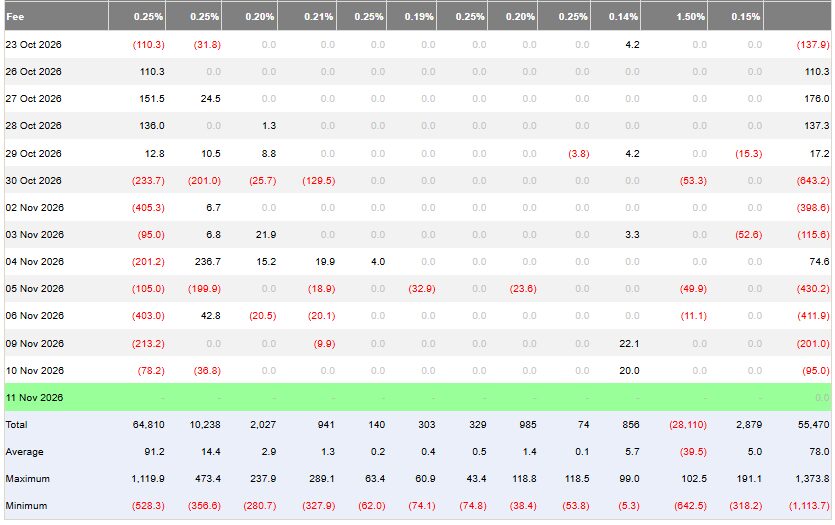
One fund accounts for nearly all the Bitcoin ETF outflows
Look at the fund columns and it’s mostly one name. BlackRock’s IBIT gave up $1.50 billion, red on every one of the seven days (from $78.2 million on Nov. 10 to $405.3 million on Nov. 2). Fidelity’s FBTC added about $56 million over the same stretch, and all the other funds put together lost roughly $133 million.
Zero in on Nov. 2 to Nov. 6 and the total is $1.28 billion in five sessions, nearly twice the $679 million outflow week covered on Oct. 12.
Bitcoin’s weekly close landed under the 50-week average
Price went the same direction. The week that began Nov. 2 finished at $74,851 on Binance, bitcoin’s fifth weekly loss in a row, and that was 0.9% below the 50-week average of $75,535. You have to go back to the week of Sept. 7 to find another weekly close under that line ($76,842, with the average at $79,667). Seven closes in between stayed above it.
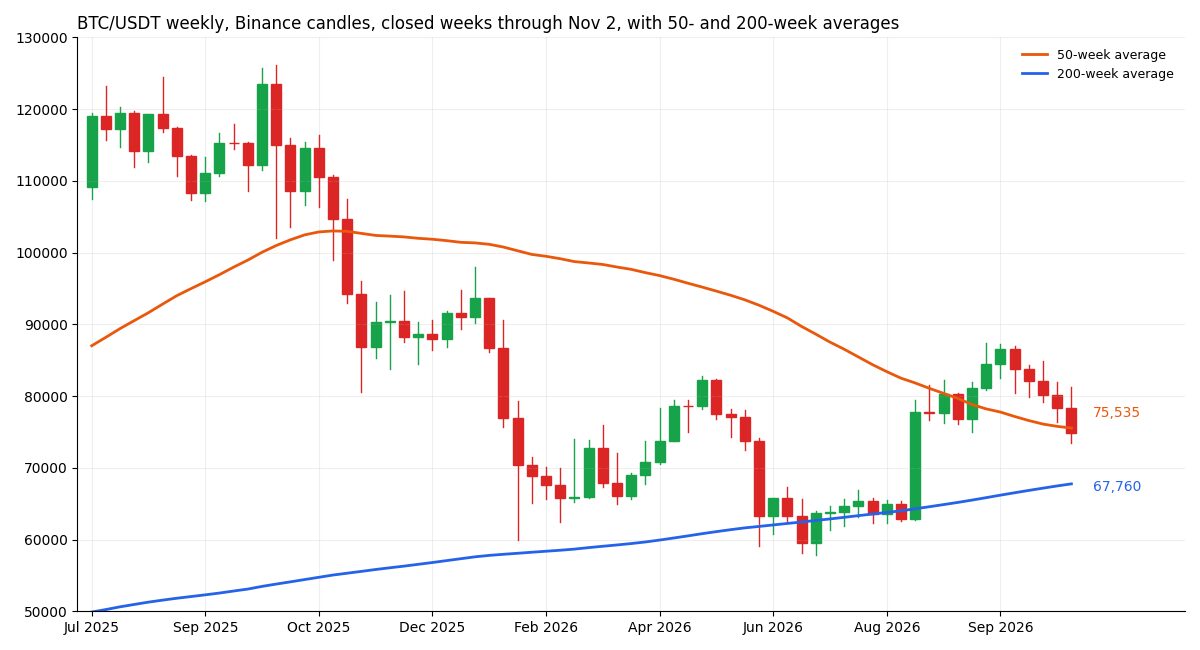
The next line down on that chart is the 200-week average, near $67,760.
Lower highs on the bitcoin daily chart
On the daily chart, rallies keep running out of room sooner. Peaks of $84,898 (Oct. 21), $81,971 (Oct. 29) and $81,196 (Nov. 4) join up in a line that sits near $79,300 on Nov. 11. Floors have been giving way too: $76,326 went on Nov. 5, $74,968 on Nov. 8, and then came $72,727 on Nov. 10, the lowest price since Aug. 20, when the low was $68,902.
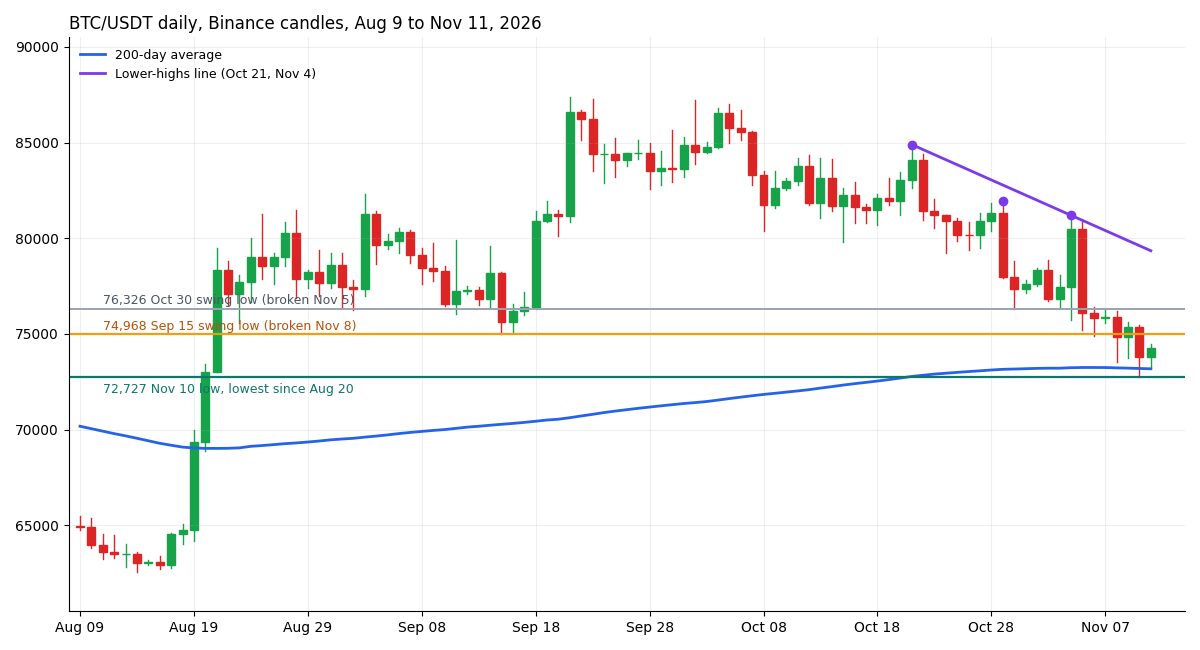
The 200-day average at $73,174 is the floor still standing: nothing has closed below it since Aug. 18. Nov. 10 closed at $73,796, and by Nov. 11 the price was back near $74,300. A Nov. 10 report covered that line.
What would change the ETF outflow picture
Two things to watch. Inflows returning, with bitcoin getting back over the 50-week average near $75,200, would make the weekly close below it a one-off. A daily close under $73,174 would leave little on the chart before the August low near $68,900 and the 200-week average.
That isn’t a forecast, and crypto is volatile enough that holders can lose money. How long the Bitcoin ETF outflows last is something the table can’t answer until more rows arrive.