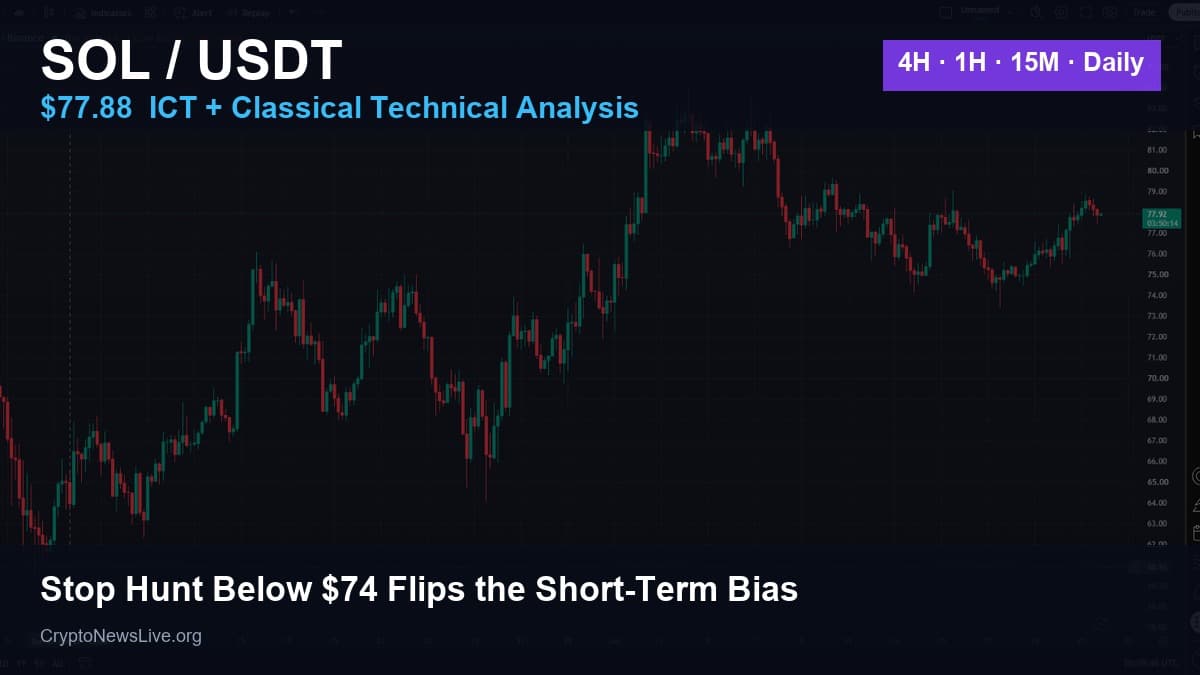
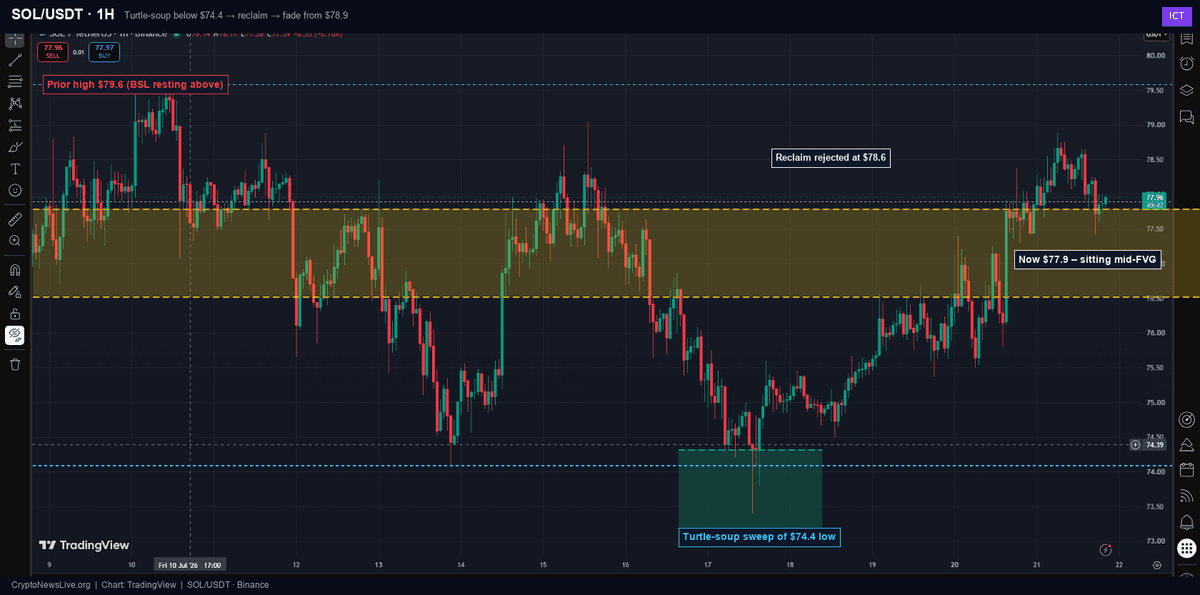
Solana traders got a stop hunt and a reversal inside the same 48 hours. Price knifed below $74.40 on July 17, tagged a low near $73.60, then turned around and reclaimed the whole range before most people had finished their coffee. SOL sits at $77.88 as of this writing, up a modest 0.4% on the day, but the shape of that move is doing more talking than the number itself.
Zoom into the hourly chart and the sequence reads like a textbook liquidity grab. A prior swing low at $74.39 had been sitting untouched for days, the kind of level where stop-loss orders tend to stack up. Price dipped through it, grabbed the resting sell orders below, and immediately reversed. Traders who follow ICT and smart-money concepts call this a turtle soup: a fake breakdown designed to trigger stops before the real move starts. What followed backs up the read. SOL ripped from $73.60 back through $76, tagged $78.6, cooled off, then pushed again to a fresh local high of $78.90 before settling into the $77-78 zone it’s trading in now.
Solana Co-founder Anatoly Yakovenko waded into an unrelated debate this week, defending AI firms’ right to train on public data under US fair use law, while Jito’s new JTX trading platform launched with an eye on institutional flow. Neither headline moved the chart directly, but they’re the kind of ambient positive noise that tends to accompany periods when price is trying to base rather than break down further.
Still Inside a Much Bigger Range
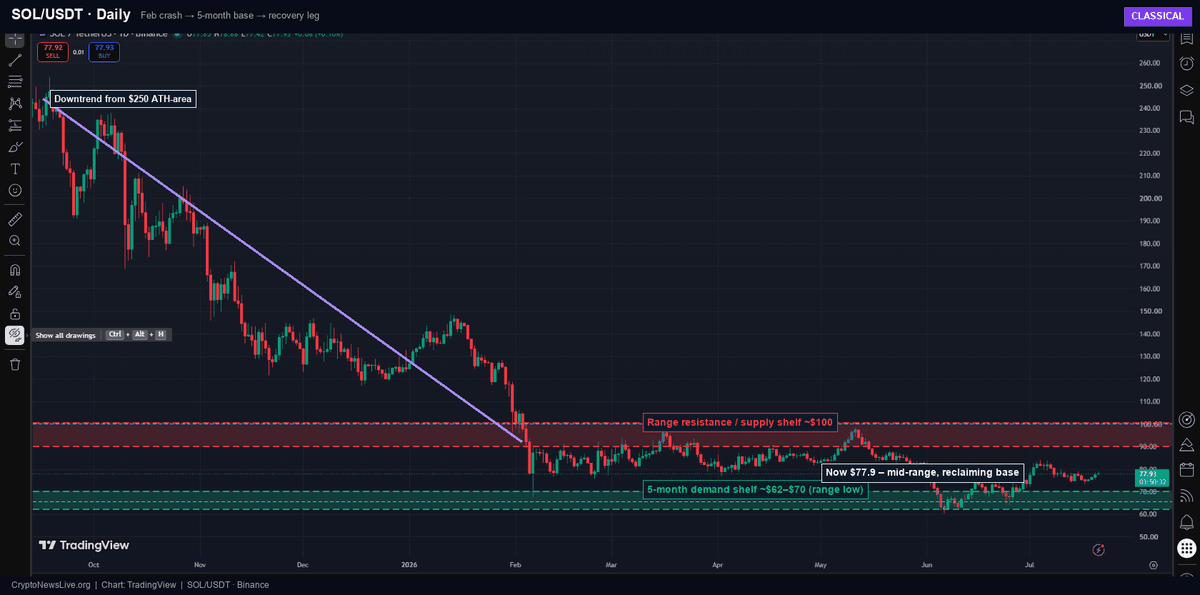
Pull back to the daily chart and the picture gets less flattering. SOL peaked near $250 last October and spent the following months grinding lower into February, eventually crashing into a five-month base between roughly $62 and $70. That base held. Price has been climbing out of it since, and today’s $77.88 puts SOL comfortably above the demand shelf but still a long way under the $90 to $100 zone that capped every rally attempt earlier this year. Classical technicians would call this a recovery leg inside a range, not a trend reversal. The descending trendline from the October top was broken back in February when the crash itself accelerated below it, so there’s no overhead diagonal resistance left to point to. The horizontal ceiling around $100 is the one that matters now, and SOL isn’t close to testing it yet.
What the 4H Chart Adds
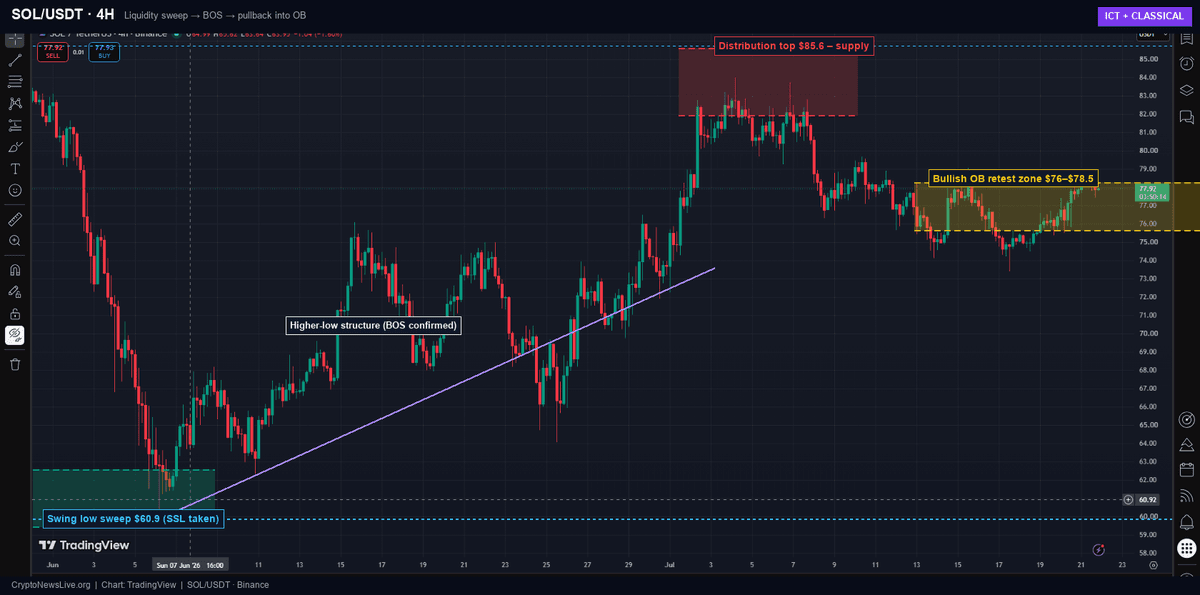
The four-hour timeframe fills in the gap between those two extremes. The swing low that eventually got swept on the hourly chart traces back to a bigger one on June 7, when SOL bottomed near $60.90. That low also got run, and the bounce off it turned into the current higher-low structure, a sequence of break-of-structure moves that ICT traders would read as confirmation the short-term trend flipped bullish back in early June. The rally off that low topped out at $85.60 in early July, a lower high than the $90-plus spikes visible on the daily chart, and it’s acted as a soft distribution zone since. Price rolled over from there, pulled back into the $76-$78.50 band, and has been consolidating in what looks like a bullish order block ever since. That’s roughly where SOL is sitting right now.
Levels That Actually Matter
None of this is a clean green light. The bullish case here depends entirely on $74.39 holding as support going forward. A four-hour close back below it would undo the reclaim and put the June low near $60.90 back in play, along with the $70-$72 area in between. On the upside, reclaiming and holding above $78.90, this week’s manipulation high, opens the door to a retest of that $82-$85.60 supply pocket on the 4H chart. Only a daily close back above the $90-$100 range highs would be enough to argue the bigger downtrend from $250 is actually over, and SOL isn’t there yet, not by a wide margin.
The Next Move, Zoomed In
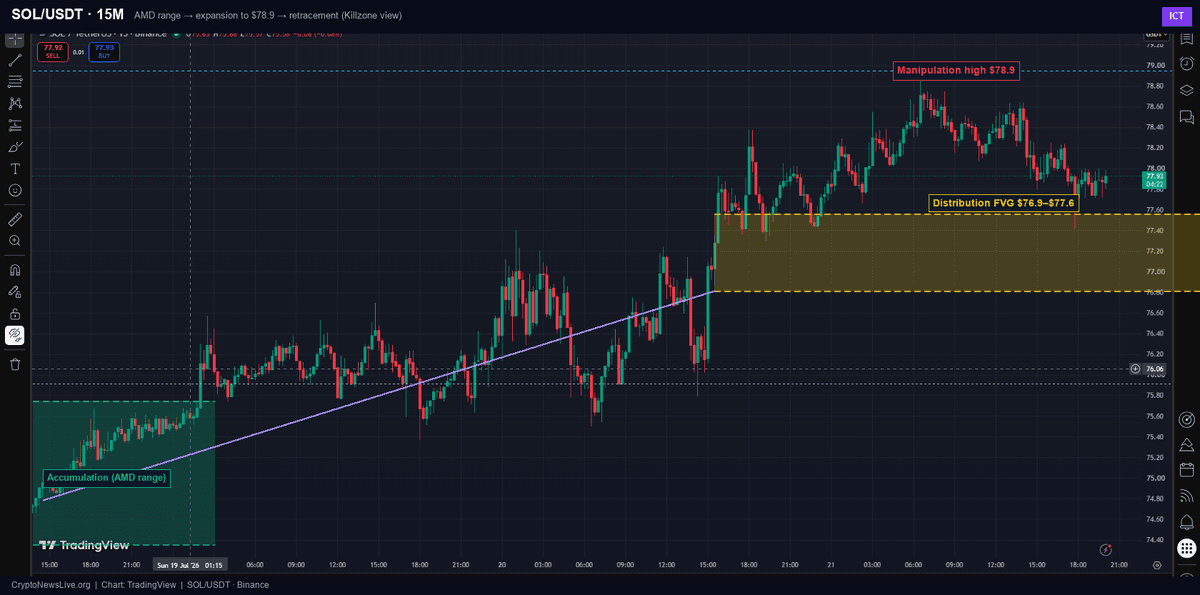
For now the fifteen-minute chart shows a fairly clean accumulation-manipulation-distribution cycle playing out over the last two days: a tight range near $75, an expansion move up to $78.90, and the beginnings of a pullback into a small gap around $77 to $77.60. Whether that gap gets filled and price keeps climbing, or whether it’s the first crack in a fade back toward the demand zone, is the next thing to watch on the SOL/USDT chart on TradingView.
This article is for informational purposes only and does not constitute financial or trading advice. Cryptocurrency markets are highly volatile; always do your own research before making investment decisions.